Chapter 3 The conundrum of research productivity
The conundrum of research productivity: a study on sociologists in Italy1
Abstract
This chapter aims to understand the influence of institutional and organisational embeddedness on research productivity of Italian sociologists. We looked at all records published by Italian sociologists in Scopus from 1973 to 2016 and reconstructed their coauthorship patterns. We built an individual productivity index by considering the number and type of records, the impact factor of journals in which these records were published and each record’s citations. We found that sociologists who coauthored more frequently with international authors were more productive and that having a stable group of coauthors had a positive effect on the number of publications but not on citations. We found that organisational embeddedness has a positive effect on productivity at the group level (i.e., sociologists working in the same institute), less at the individual level. We did not find any effect of the scientific disciplinary sectors, which are extremely influential administratively and politically for promotion and career in Italy. With all caveats due to several limitations of our analysis, our findings suggest that internationalisation and certain context-specific organisational settings could promote scientist productivity.
Keywords: Sociologists, Italy, Research productivity, Internationalisation, coauthorship
3.1 Introduction
Research work of scientists does not happen in a social and institutional vacuum. Certain institutional and structural factors might influence scientist’s work, including research priorities, publication strategies and collaboration (Shapin 2009). Indeed, previous studies suggested that scientist motivations and publication strategies are sensitive to institutional policies, i.e., career incentives, norms and rewards (Katz and Martin 1997; Lamont 2009; Bland, Ruffin, and others 1992).
However, understanding institutional embeddedness of scientist work is complicated due to the multi-layered nature of institutions. First, country-specific rules and standards might influence scientist work by providing not only positive or negative incentives but also cognitive frameworks that scientists use to make sense of what they do (Provasi, Squazzoni, and Tosio 2012). For instance, recent research assessments performed by national authorities in the UK, Australia and Italy (e.g., Abramo and D’Angelo 2011b; Beerkens 2013), emphasized the reputational signal of publications in prestigious international journals and the importance of article citations as a (direct or indirect) measure of scientists’ value (e.g., Rijcke et al. 2016), Far from being neutral, these institutional assessments often embody standards that are irrespective of context specificities and typically have a performative function on scientist work (e.g., Timmermans and Epstein 2010; Wilsdon et al. 2015). Indeed, scientists can orient their research or change the outlet of their publication to fit these standards better (e.g., Burrows 2012). In this respect, the recent debate about pros and cons of measuring scientist work by bibliometric indicators and their potential misuses testifies to the widely shared belief that quantitative rankings might have unintended consequences, such as altering scientist publication strategies (e.g., Hicks et al. 2015) and nurturing excessive competitive spirits (e.g., Edwards and Roy 2017).
Secondly, specific incentives might operate more locally as academic organisations in which scientists are embedded tend to constrain individual perceptions and strategies even simply as a means to solve organisational uncertainty (Weick 2016). However, sometimes this gives rise to semantic, strategic and operational meanings and actions that are misaligned with broader institutional pressures (e.g. Whitley 2003), such as in recent cases of boycotting rankings (see the case of German sociologists in Berlemann and Haucap 2015; Stergiou and Lessenich 2014).
To complicate even more the picture, research suggests that scientific community has its own endogenous drivers, which might even be resilient to exogenous institutional pressures. While scientists tend to collaborate internationally more and more independently of their field (Leydesdorff, Park, and Wagner 2014), however, it is likely that different sub-communities in which the scientific community is stratified have a variety of initial conditions that amplifies certain differences in cultures and attitudes towards research, collaboration and even findings communication (Hakala and Ylijoki 2001). Therefore, institutional incentives could be even interpreted by scientists differently depending on specific standards and norms of their community.
This chapter aims to understand if certain institutional and structural factors are associated with differences in individual research output. To do so, we performed an empirical analysis of the institutional and organisational embeddedness of research productivity of sociologists in Italy.
The case of Italy is interesting for various reasons. First, in 2006, the Italian government established an independent evaluation agency, i.e., ANVUR2 (ANVUR 2013), with the aim to assess the performance of all research institutes in the country (i.e., 95 universities and public research institutes) (Turri 2014; Geuna and Piolatto 2016). While this assessment was based on different productivity indicators aimed to assess institutes and not scientists, it also explicitly conveyed a strong message about the importance of productivity and quantitative indicators to anyone. Secondly, ANVUR was also involved in developing common standards for the national habilitation of all new associate and full professors, which linked promotion and resources to research productivity. These standards generated a large debate within the scientific community, were contrasted by many academics, especially from the humanities, and in some cases generated contrasting outcomes (e.g., Baccini and De Nicolao 2016). However, they marked the beginning of a cultural change in the institutional settings of Italian academia, with scientists who were unfamiliar with international standards learning for the first time what h-index, WoS (Web of Science) and Scopus meant.
Furthermore, the case of sociologists is interesting for two reasons. First, sociologists are part of a community that includes humanities scholars, who are predominantly qualitative, anti-bibliometric and publish preferably in national journals and “hard” scientists, who are quantitative, are familiar with bibliometric indicators and publish preferably in international journals. The co-existence of different epistemic communities among sociologists makes this an interesting case to examine contrasting forces towards internationalisation. Secondly, it is important to note that except for a few noteworthy examples (e.g., Bellotti, Kronegger, and Guadalupi 2016; Bellotti, Guadalupi, and Conaldi 2016) research on scientists’ productivity in Italy have looked mainly at communities of hard scientists (e.g., Abramo, D’Angelo, and Rosati 2016b). Research in humanities and social sciences is hardly examinable quantitatively as either scientists in this field do not publish only WoS or Scopus indexed sources or they value more quality over quantity (Abramo and D’Angelo 2014b; Bellotti, Kronegger, and Guadalupi 2016; Nederhof 2006).
Our chapter aimed to fill this gap by providing a quantitative analysis of research productivity of Italian sociologists. The rest of the chapter is organised as follows. Sect 2 discusses certain institutional, organisational and individual factors that might influence scientist research productivity. While previous studies have elaborated models that estimate scientist productivity for assessment, here we tried to complement these models with attention to explanatory variables. Sect 3 presents our data. Although our study included only cross-section data, we considered time dependent variables and found interesting associations between institutional and organisational factors and productivity. Sect 4 presents our results, while Sect 5 summarizes our main findings and discusses certain limitations of our work.
3.2 The conundrum of research productivity
Measuring research productivity of scientists and understanding the influence of institutional and organisational factors is complicated (e.g., Pepe and Kurtz 2012). While certain indexes that measure the impact of scientist work, such as the h-index introduced by Hirsch (Hirsch 2005; for an extensive review see Egghe 2010), have become popular also outside academia, research showed that they were not sufficiently robust, general and contemplated extensions (Hirsch 2010) and alternatives (e.g., Batista, Campiteli, and Kinouchi 2006; Pepe and Kurtz 2012). However, these problems are also due to the puzzling nature of scientific productivity: any empirical observation shows that the distribution of productivity among scientists is not normal (e.g., Ellwein, Khachab, and Waldman 1989).
Furthermore, research has suggested that productivity might be influenced by a nexus of individual, institutional and organisational factors (e.g., Provasi, Squazzoni, and Tosio 2012). This combination of factors challenges our understanding of the mechanisms that drive productivity differences.
For instance, in a review paper on previous studies of research productivity, Fox (1983) found that scientist attitudes, interests and abilities might explain differences in research productivity among scientists. Productive scientists are intrinsically motivated by a kind of inner compulsion that makes them working even if they are not exposed to external rewards. This included ego strength, personal dominance, preference for precision and exactness, strong control of impulse and a sincere preoccupation about ideas more than concrete aspects. It is worth noting that Fox suggested these qualities emerged even in the early stage of a scientist’s career. This was also confirmed by Ramsden (1994) in a survey on 890 academics in 18 Australian higher education institutions. Findings showed that productivity was influenced by a scientist’s early interest in research.
More recently, in a survey of 465 full-time faculty members in a medical school at the University of Minnesota-Twin Cities, Bland et al. (2002) and Bland et al. (2005) expanded the analysis towards more complex factors that sustain individual productivity. These not only included the importance of personal motivation, including the development of an idea, autonomy and work habit. A profound socialization process, which aligned individual and organisational objectives, being involved in simultaneous projects (engagement in multiple concurrent projects makes it easier to tolerate if one project stalls or fails) and being involved in organisational and extra-organisational activities had positive effects on scientist productivity. This means that individual characteristics were essential but not sufficient to explain scientist productivity. Their findings suggested that individual characteristics and academic organisation structure and leadership tend to self-reinforce.
The fact that productivity does not materialise in a social and institutional vacuum has been recognized by many studies. Indeed, certain institutional policies and some priorities established by research organisations can provide positive or negative incentives to productivity, which may even contribute to orient publication strategies (e.g., Ramsden 1994). As suggested by Fox (1983), “scientific work is very social enterprise, depending a great deal on interactions that are facilitated -or not- by one’s environment”. As suggested by Bland, Ruffin, and others (1992) (see also Nygaard (2015)) the establishment of strategic goals by academic organisations with an explicit focus on research excellence or innovation are key factors to stimulate scientist output by increasing also in-out mobility and talents’ attractiveness (see also Long and McGinnis 1981).
In an influential study, based on a national sample of faculty in both four-year colleges (N = 1216) and universities (N = 7484) in USA, Blackburn, Behymer, and Hall (1978) emphasized the role of organisational context in explaining differences in scientist output. They found that scientist hired in more prestigious organisations published considerably more and suggested a complex interplay of scientist excellence and positive environment. For instance, besides the effect of career trajectories, certain department characteristics, such as the size and prestige, were positively interrelated with scientist productivity. Similarly, in a study on two groups of biochemists, Long (1978), found that while scientist productivity did not greatly contribute to the prestige of academic organisations, scientist productivity greatly benefited from the prestige of the academic organisation in which scientists were embedded. More recently, Lazega et al. (2008) in a study on top cancer research in France in the late 1990s, in which interdependencies between organisational and individual levels of scientist performance were investigated, found that the position of an academic organisation in the inter-organisational network was even more important than the scientist position in the top scientist network to explain scientist performance. This would even indicate that selection effects, i.e., more prestigious organisations tend to hire preferably more productive scientists, could be less important than organisational embeddedness effects, i.e., scientists being more productive because they were hired by more prestigious organisations (e.g., Long and McGinnis 1981; Ramsden 1994), although here it is difficult to dissect causal factors.
Finally, it is important to note that scientists are also sensitive to implicit or explicit standards that are intrinsic to the type of research they perform (e.g., high-tech lab vs. low-tech individual research (Kronegger et al. 2011)), not to mention the influence of certain practices that emerge via direct or indirect scientific collaboration. In a review on publication, research productivity and citation patterns in the humanities and social sciences, Nederhof (2006) found that natural scientists are more prolific than social scientists and humanities scholars (see also Blackburn, Behymer, and Hall 1978), while these latter tend to cite earlier works more frequently (see also Price 1970). Furthermore, when considering the different size of the communities, which also implies a different number of journals, articles and potential citations, analysing scientist productivity and citation patterns without considering context-specific factors can probably lead to misplaced conclusions.
To sum up, the complexity of factors involved in determining scientist productivity makes difficult to develop robust, across-domain valid measures. On the one hand, research productivity measures are applied to complex aggregates so that the effect of contextual factors is not considered. On the other hand, although indicators are aimed at assessment more than explanation, research assessment should try to incorporate these factors to provide more informed and context-specific recommendations. If scientific outputs and research productivity might strongly depend on individual, institutional and contextual factors, understanding these factors is of paramount importance also to reveal existing forces that are largely resilient against institutional policies.
3.3 Method and Data
Our dataset was based on a mix of available institutional data from the MIUR (Italian Ministry of University and Research) and publication records collected from Scopus. We, first, gathered from the MIUR website a list of all sociologists currently enrolled in Italian Universities and research centers, including faculty members (1,029 in total) and postdocs (198 in total). This included information about the subject’s current academic position (i.e., assistant, associate or full professor), the “scientific disciplinary sector”3 in which s/he has been formally assigned (e.g., political sociology, economic sociology etc.), gender, affiliation, department, and last and first name.
It is important here to note that “scientific disciplinary sectors” in Italy are not only bureaucratic categories with administrative functions; they are key for job competition, recruitment and career. They can also embody implicit research standards that might be different from case to case (e.g., Abramo, D’Angelo, and Rosati 2016a). Furthermore, in order to examine the potential impact of the characteristics of the department in which a scientist works, we classified each of the 200 departments in which at least one sociologist faculty member was present into the following seven coherent areas: “Humanities”, “Social Sciences”, “Engineering”, “Economics”, “Medicine”, “Psychology” and “Other”. This classification was made by checking manually the department faculty composition and teaching courses on departments’ online websites. Finally, as a control variable, we used ANVUR’s ranking of university research performance as a proxy of the quality of the university in which sociologists were working. Following ANVUR (2014), we classified any university in high, medium and low ranking. Finally, given the known disparities of developments between regions in Italy, we considered the geographical distribution of universities in Center, Islands, North and South of Italy.
As regards publication records, we collected all available records for all scientists included in the above list from Scopus. We preferred Scopus to Web of Science (WoS) and Google Scholar for the following reasons. First, Scopus covers more social science literature than WoS (e.g., it includes more journals, and monographs from prestigious international publishers) but is more restricted to scientific literature than Google Scholar, which sometimes includes also non-scientific publications. Secondly, unlike WoS, Scopus covers the most prestigious sociology journals in Italy, such as Sociologica, Stato e Mercato and Rassegna Italiana di Sociologia, just to name a few, in which Italian sociologists publish frequently if not exclusively. Finally, Scopus is usable for large-scale data mining more efficiently and less erroneous than WoS and Google Scholar.4
Our data included all the available fields of the Scopus database, including for each scientist’s publication: title, authors’ names, source title, year of publication, number of citations received, permanent link to the publication, authors’ affiliations, abstract, keywords, references. By using Scopus data fields, we also considered the type of documents produced by each scientist (i.e., “Article”, “Review”, “Book Chapter”, “Book”, “Erratum”, “Editorial”, “Note”, “Conference Paper”, “Article in Press”, “Letter”, “Short Survey”), and the publication language (i.e., “Italian”, “English”, “French”, “Dutch”, “Spanish”, “Slovak”, “German”, “Portuguese”, “Croatian”, “Hungarian” were the languages Italian sociologists have been publishing).5
To assess if our data from Scopus covered the most prestigious and known journals in which Italian sociologists typically publish, we checked the publications in our sample, and found that the first 24 percent (786 papers) were published in the following 19 journals: Sociologia, International Review of Sociology, Rassegna Italiana di Sociologia, Salute e Societa, Studi Emigrazione, Stato e Mercato, Quality and Quantity, Italian Sociological Review, European Societies, European Sociological Review, Sociologica, Journal of Modern Italian Studies, Etnografia e Ricerca Qualitativa, European Journal of Social Work, European Journal of Communication, Polis (Italy), Current Sociology, Lecture Notes in Computer Science, South European Society and Politics. This confirmed that the most prestigious Italian journals were represented in the dataset.
In order to measure scientist output and examine the effect of certain institutional and structural factors, we first elaborated a “productivity index”, which included the total number of each scientist’s publications \(P\) (such as: Ellwein, Khachab, and Waldman 1989; Katz and Martin 1997) and his/her scientific career length \(t\) (e.g. \(Pr = \frac{P}{t}\)). Values were then standardized to a scale of 0-1 based on the distribution of publications of all scientists. Then, we compared each scientist with average citations of his/her scientific disciplinary sector (e.g., Abramo, D’Angelo, and Di Costa 2011; Abramo, Cicero, and D’Angelo 2013; Opthof and Leydesdorff 2010) as well as with that of the whole population of sociologists.
After testing these options, we followed Abramo and D’angelo (Abramo, D’Angelo, and Di Costa 2011; Abramo and D’Angelo 2011b) and developed a production function by considering a microeconomic point of view. They built an index called FSS (Fractional Scientific Strength), which measured: (a) resources used by scientists, e.g., time, and (b) scientific outputs, e.g., publications, and c) citations, as a measure of the impact of research as follows: \[FSS_R = \frac{1}{t}\sum_{i=1}^N \frac{c_i}{\bar{c}}f_i\] where \(t\) was the time window between first publication and the last one for each scientist, e.g. a proxy of time invested for research, \(N\) was number of his/her publications, \(c_i\) was number of citations that each publication \(i\) collected and \(\bar{c}\) was average number of citations that each publication received compared to average citations of all other records published in the same year. This was to control for cumulative time effects in citations and avoid comparing citations received by an article published in 2015 by scientist A with citations received by an article published in 2000 by scientist B. In case of postdocs, given that MIUR did not assign them to any specific scientific disciplinary sector, when calculating their \(FSS\), we compared their citations with those of all other postdocs in the same year. Finally, \(f_i\) is the inverse of the number of authors (fractional contribution of each author to paper).
We also looked at each scientists level of international collaborations (see, Katz and Martin 1997; Leydesdorff, Park, and Wagner 2014) and built an “internationalisation index”, which considered the coauthors’ affiliation and country (e.g., Leydesdorff, Park, and Wagner 2014) and calculated the number of authors with non-Italian affiliations \(a_f\) on the total number of authors of each paper \(a\). We aggregated this value by averaging the internationalisation scores of all publications, \(N\) as follows: \[IntScore = \frac{1}{N}\sum_{i=1}^N \frac{a_f}{a}\]
Finally, we looked at the coauthorship composition. First, we measured the mean number of coauthors with dividing sum of number of authors of each paper \(a_i\) over number of all papers \(N\), as follows:
\[AverageCoauthors = \frac{1}{N}\sum_{i=1}^N a_i\]
Then, we calculated a “coauthor variety index”, which measured the extent to which scientists collaborate with the same coauthors or tended to change coauthors over time. Here, we wanted to verify, first, whether the tendency of social scientists and sociologists to perform research individually, which was found in previous studies (e.g., Becher and Trowler 2001, 125; Smith 1958), could be also found among Italian sociologists. Secondly, we wanted to understand if this attitude could have implications on productivity. Indeed, previous research suggested that scientists who collaborate with a variety of coauthors tend to publish more (e.g., Rumsey 2006; Kuzhabekova 2011). To measure this, we built a matrix that included each scientist’s coauthors and used inverse log-weighted similarity (Csardi and Nepusz 2006) to measure the propensity of each scientist to work preferably with different or stable coauthors through his/her scientific career (note that also here we standardized this value to a scale of 0-1).
3.3.1 Crossed membership multi-level modeling
In order to examine the importance of institutional embeddedness, we assumed that each scientist in our database was nested in different clusters, possibly having an influence on his/her productivity. We considered three clustering levels: (1) the department, as the first level of organisational embedddness, probably the most important one, as promotion and careers are eventually decided locally, (2) the scientific disciplinary sector, which is important both for power, careers and strategic relations, sometimes also for research and collaboration, and (3) the university, as the second level of organisational embedddness, which became especially important in Italy after the last reform of the national university system in 2010 with important prerogatives given to university governance for incentivising and measuring scientist productivity, e.g., by establishing rewards for research excellence and allocating internal resources on productivity indicators. Sociologists in similar department could belong to different scientific disciplinary sectors and sociologists in similar departments in different universities could be exposed to similar cultural contexts. In order to accommodate this complexity, we used crossed membership random effects structure(Baayen, Davidson, and Bates 2008).
In order to model this nestedness and crossed membership, we followed previous studies (Snijders and Bosker 1999; Faraway 2005; Zuur et al. 2009), and used hierarchical linear models. This allowed us to examine the effect of these levels in a more robust manner. For instance, an assistant professor of political sociology (i.e., this is the scientific disciplinary sector) who was enrolled in a department of social sciences in a given university could have different intercept (starting point) and slope (growth rate) in a regression model compared to a full professor of economic sociology in the same university and department. However, given the complex structure of random effects in the model and the number of control variables, e.g., gender, academic status and coauthor variety, we could not add all possible fixed effects simultaneously. Rather, we followed a step-wise approach by checking the differences from a baseline model (with full random effects structure) and examined each of our fixed effects step-by-step while keeping the same random structure and control variables (gender, stability of coauthors, and academic level).
3.4 Results
It is first important to note that only 63.81% of 1,227 Italian sociologists had at least one publication indexed in Scopus. The remaining 36.19 % of Italian sociologists either did not publish a single record (see Hâncean and Perc 2016) or more probably published research in non-indexed sources, such as some national journals or monographs and books. Coherently with previous research in Italy (e.g., Abramo, D’Angelo, and Caprasecca 2009b) even by simply looking at the probability of having a Scopus profile, we found a gender effect although not so strong. The percentage of male and female scientists who had a Scopus profile (i.e having at least one paper, book or book chapter in outlets that are indexed by Scopus) is 10.09 % different from each other (male = 55.04%, female = 44.96%). We also found that sociologists working in northern Italy or highly ranked universities had a higher probability of having a publication in Scopus (high rank universities 59.39 % of total; northern universities 53.13 % of total). Table 3.1 presents a descriptive view (mean and median) of total number of publications and FSS of sociologists compared over geographical regions, universities of different ranks, sectors and departments.
| Main | Sub-Category | Mean FSS | Median FSS | Mean # Pub | Median # Pub |
|---|---|---|---|---|---|
| Geo Region | center | 0.0330 | 0.0003 | 3.3166 | 2.0 |
| Geo Region | isolated | 0.0181 | 0.0000 | 2.2826 | 1.0 |
| Geo Region | north | 0.0479 | 0.0153 | 5.6851 | 3.0 |
| Geo Region | south | 0.0232 | 0.0004 | 3.1557 | 2.0 |
| University Rank | high | 0.0331 | 0.0061 | 4.2989 | 3.0 |
| University Rank | low | 0.0572 | 0.0000 | 4.1875 | 2.0 |
| University Rank | medium | 0.0448 | 0.0075 | 4.8704 | 2.0 |
| Sector | postdoc | 0.0682 | 0.0000 | 2.7593 | 2.0 |
| Sector | SPS/07 | 0.0319 | 0.0029 | 4.7023 | 3.0 |
| Sector | SPS/08 | 0.0317 | 0.0066 | 4.7463 | 2.0 |
| Sector | SPS/09 | 0.0429 | 0.0136 | 5.6078 | 3.0 |
| Sector | SPS/10 | 0.0350 | 0.0098 | 4.4419 | 2.0 |
| Sector | SPS/11 | 0.0480 | 0.0227 | 4.0667 | 2.5 |
| Sector | SPS/12 | 0.0124 | 0.0007 | 3.8485 | 2.0 |
| Department | Economics | 0.0378 | 0.0000 | 4.3333 | 2.0 |
| Department | Engineering | 0.0277 | 0.0028 | 3.4375 | 2.5 |
| Department | Humanities | 0.0362 | 0.0055 | 4.4657 | 2.0 |
| Department | Medicine | 0.0063 | 0.0015 | 3.5556 | 3.0 |
| Department | Other | 0.0160 | 0.0016 | 3.0000 | 3.0 |
| Department | Psychology | 0.0351 | 0.0188 | 3.7778 | 2.0 |
| Department | Social Sciences | 0.0414 | 0.0089 | 4.6528 | 3.0 |
As expected, the distribution of publications was highly skewed (see Figure 3.1 below) with a few sociologists publishing a considerable fraction of the total number of publications. which is in line with previous studies (Nygaard 2015; Ramsden 1994; Coile 1977; Ellwein, Khachab, and Waldman 1989).
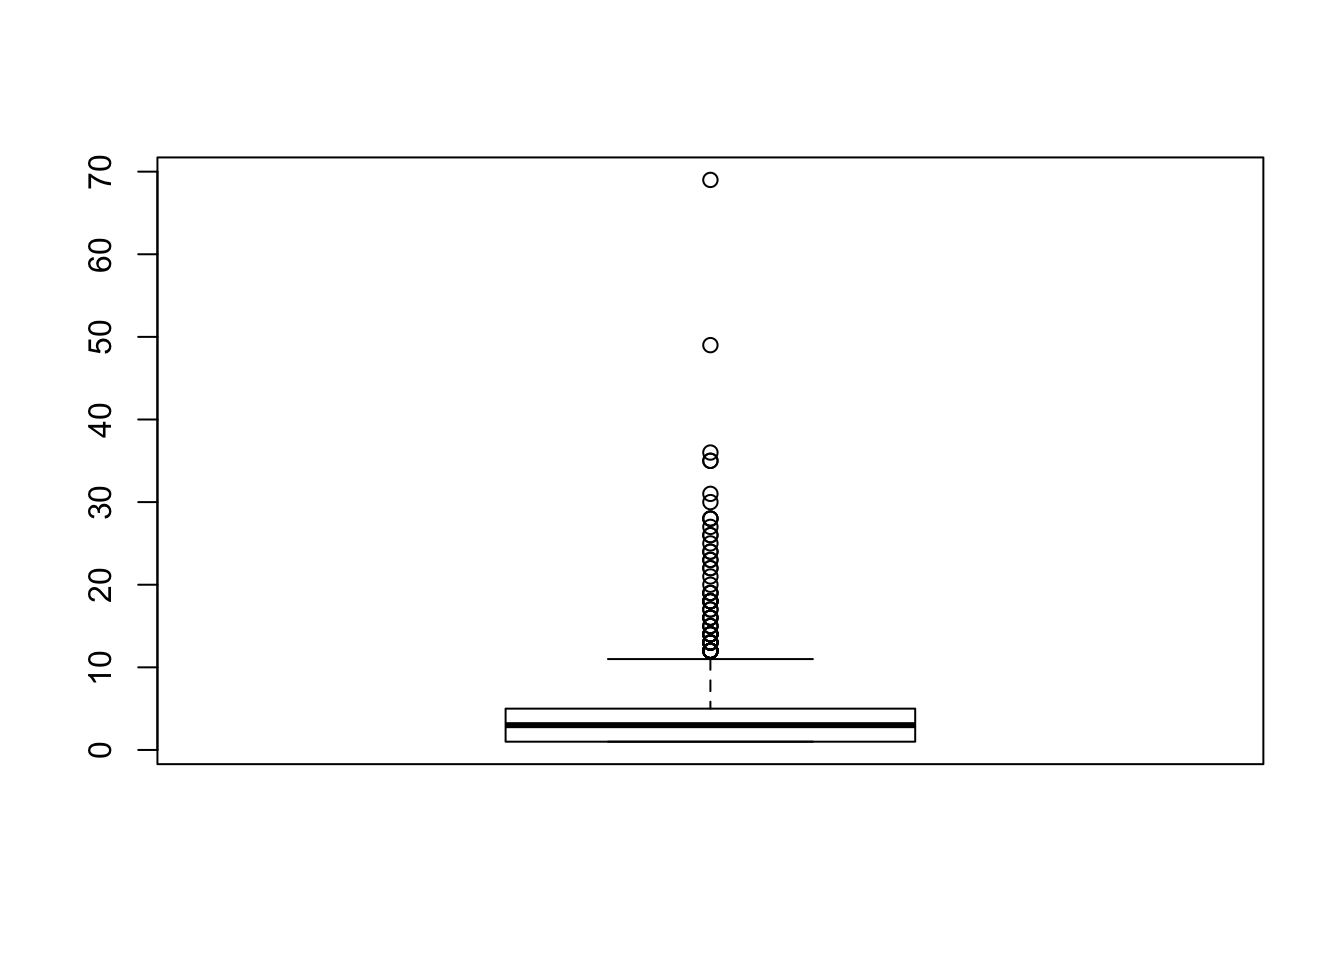
Figure 3.1: Distribution of the total number of publications (Scopus data); (black line is the median)
Our model confirmed a skewed distribution with a concentration of scientists close to null values (Figure 3.2). The same was found when looking at citations (e.g., Bornmann 2010): there were sociologists having up to nine records without a single citation. While recognition of scientific contributions can be often delayed in time (e.g., Garfield 1980 as cited in @abramo2011evaluating), our results show a considerable number of records published before 2000 without any citation (see Figure 3.3).
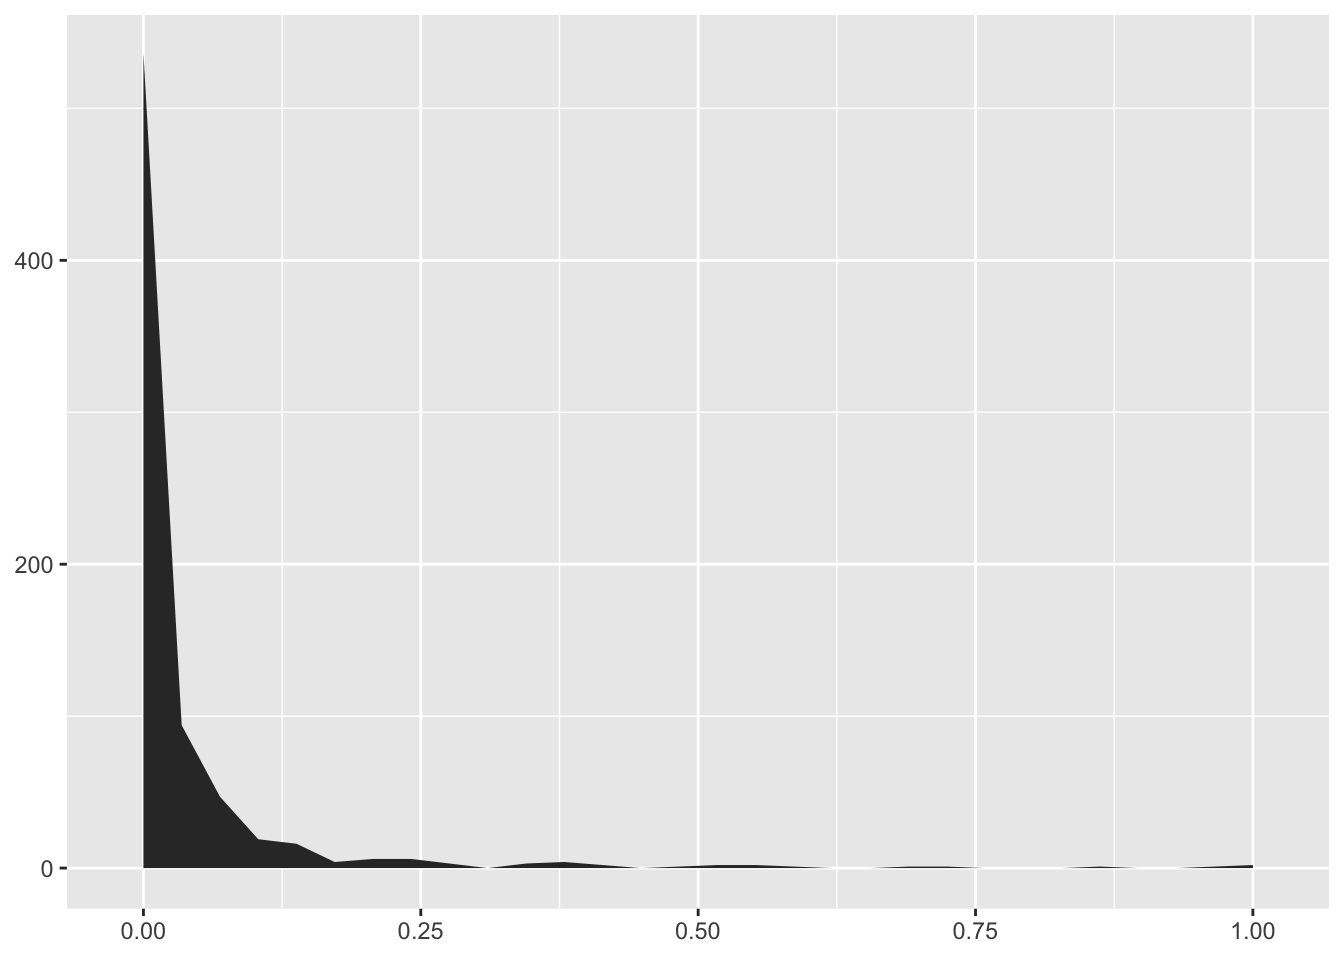
Figure 3.2: Distribution of FSS in subset of population with at least one publication (Scopus data), X = FSS (from 0-1 with 1 as maximum), Y = Frequencies
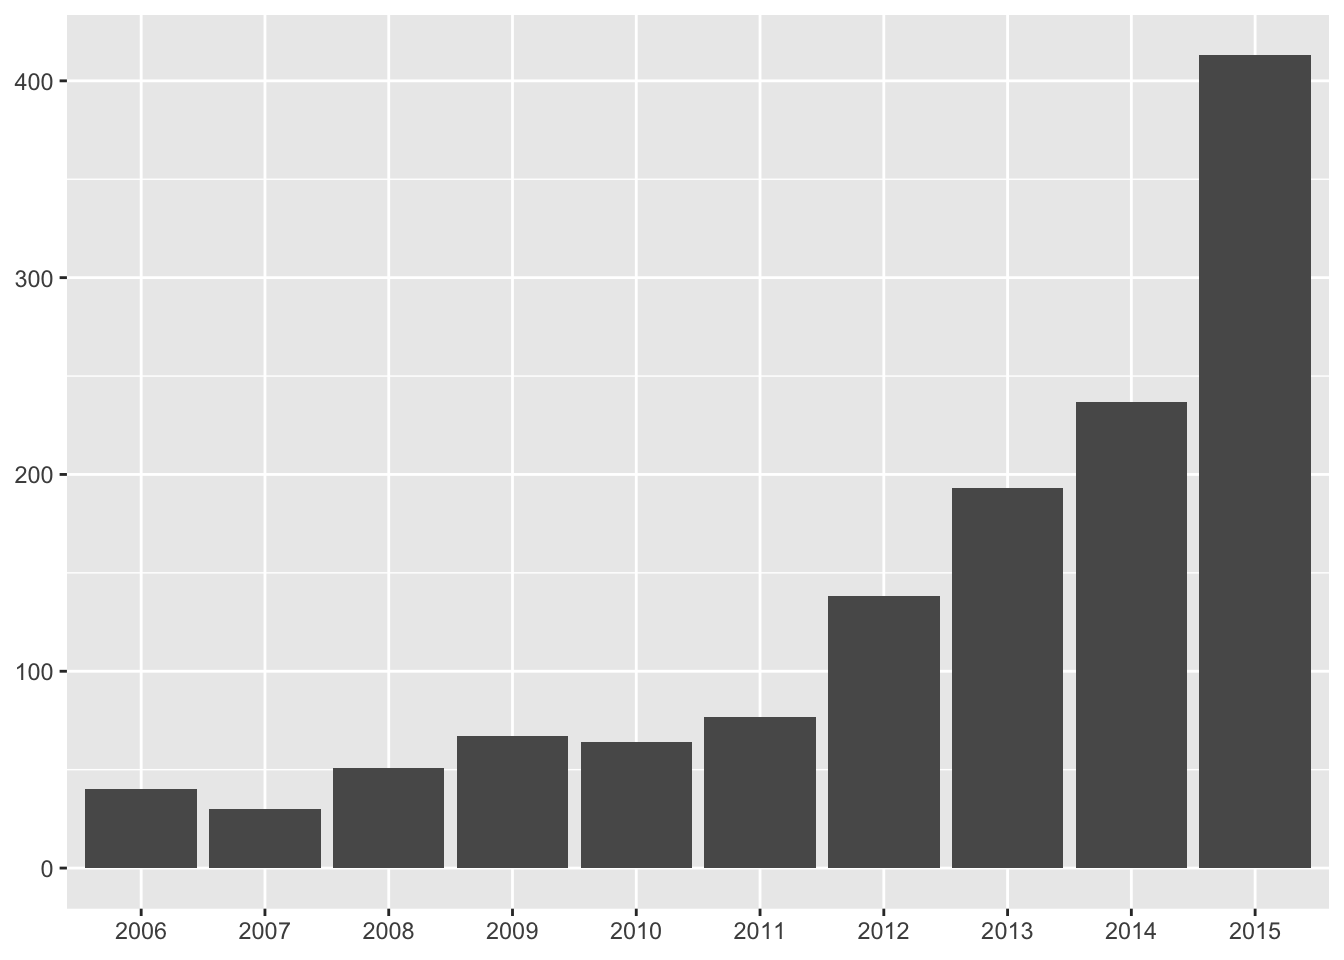
Figure 3.3: Distribution of articles never cited over time (Scopus data). X = years, Y = frequencies
Following Abramo, Cicero, and D’Angelo (2013), we restricted our analysis only to sociologists with FSS values higher than 0. We also added the impact factor of journals (e.g., Abramo, D’Angelo, and Di Costa 2008; Ellwein, Khachab, and Waldman 1989), by considering, for the sake of simplicity, the 2015 impact factor (\(IF\)) as: \(FSS_R = \frac{1}{t}\sum_{i=1}^N \frac{IF.c_i}{\bar{c}}f_i\), where \(IF\) was the impact factor of the journal that paper was published. This was to capture not only citations but also the prestige of journals in which articles were published. We run our nested layered model to examine the effect of organisational and institutional embeddedness on the FSS value of each single scientist. Given the size of certain variables, e.g., 78 universities, here (in Table ??) we presented only the most interesting results.
Table ?? shows that sociologists who collaborated more with international coauthors have higher research productivity, i.e., more publications and higher citations. This confirms previous findings by F. Narin, Stevens, and Whitlow (1991) and Francis Narin and Whitlow (1991) and Khor and Yu (2016): internationally coauthored articles attract more citations and this makes scientists’ research investments more valuable. Secondly, we found that gender matters: male are more productive than female sociologists. This confirms previous findings on gender gap in publications in a variety of national contexts (e.g., Blackburn, Behymer, and Hall 1978; Prpić 2002; Hancock and Baum 2010; Abramo, D’Angelo, and Caprasecca 2009b). Previous research suggested many explanations of this gap, including the negative impact of maternity leave and higher involvement in family obligations (e.g., Stack 2004; Prpić 2002). We also found an effect of academic status. Indeed when considering the fractional contribution of each coauthor to each publication, full professors were less productive than younger scholars. This would indicate that younger scholars are more propense to publish in prestigious journals probably due to stronger competitive pressures that make productivity signals more important than in the past6.
Interestingly, contextual factors were not significantly associated with productivity. Lower and medium ranked universities seem to include sociologists with similar productivity to top-ranked ones. This would indicate that excellence in research in sociology is not concentrated in top universities but spread in peripheral institutes or equally low in all regions and more driven with other variables discussed (see Table ?? and ?? in the Appendix).7
| log(FSS) | Total Publications | ||
|---|---|---|---|
| Constant | -4.03 (0.22)*** | 0.02 (0.01) | |
| Internationalisation | 0.91 (0.34)** | 0.10 (0.02)*** | |
| Coauthors Stability | 0.12 (0.69) | 0.46 (0.05)*** | |
| Gender (male) | 0.39 (0.14)** | 0.03 (0.01)** | |
| Associate professor | -0.27 (0.16) | 0.02 (0.01) | |
| Full professor | -0.38 (0.19)* | 0.03 (0.01)* | |
| Postdoc | 0.99 (0.43)* | 0.10 (0.02)*** | |
| AIC | 1652.31 | -702.13 | |
| BIC | 1697.66 | -656.38 | |
| Log Likelihood | -815.15 | 362.07 | |
| Num. obs. | 456 | 473 | |
| Num. groups: university | 60 | 61 | |
| Num. groups: sector | 7 | 7 | |
| Num. groups: department | 7 | 7 | |
| Var: university (Intercept) | 0.29 | 0.00 | |
| Var: sector (Intercept) | 0.11 | 0.00 | |
| Var: department (Intercept) | 0.00 | 0.00 | |
| Var: Residual | 1.89 | 0.01 | |
| p < 0.001; p < 0.01; p < 0.05 | |||
We also looked at the effect of the variety of coauthors (see coauthors stability in Table ??). Research suggested that more productive scientists tend to follow two types of coauthorship strategies, i.e., working with cohesive groups of coauthors or bridging between distant and disconnected groups of coauthors (Burt 2005; Bellotti, Guadalupi, and Conaldi 2016; Rumsey 2006; Kuzhabekova 2011). It is probable that the second strategy is more feasible in hard sciences in which more generous grants and high-tech lab research stimulate more collaboration (Becher and Trowler 2001; Smith 1958). Our results showed that working in a more stable group of coauthors was positively associated with the number of publications (see model 2 in Table ??) but not with research productivity, i.e., FSS (see model 1 in Table ??). This means that if we consider also the impact of research in terms of citations, collaborating with the same coauthors seems not to give any advantage. This is reasonable as working with larger groups of coauthors from different countries and so connecting different communities could yield higher citations (F. Narin, Stevens, and Whitlow 1991; Francis Narin and Whitlow 1991; Khor and Yu 2016)
| Model 1: FSS | Model 2: Total Publications | ||
|---|---|---|---|
| Internationalisation | 0.06 (0.02)*** | 0.09 (0.02)*** | |
| Gender | 0.01 (0.00)* | 0.00 (0.00) | |
| Academic level | 0.01 (0.00)* | 0.02 (0.00)*** | |
| Rho | 0.19 (0.02)*** | 0.16 (0.02)*** | |
| R^2 | 0.03 | 0.07 | |
| Adj. R^2 | 0.02 | 0.07 | |
| AIC | -1590.10 | -1335.57 | |
| BIC | -1567.06 | -1312.34 | |
| Log Likelihood | 800.05 | 672.78 | |
| p < 0.001; p < 0.01; p < 0.05 | |||
In order to check for autocorrelation, we followed Leenders (2002) and Bellotti, Guadalupi, and Conaldi (2016) and run a network disturbance model. By using LNAM (Linear Network Autocorrelation Moldels) (Butts 2016) (see Table ??), we looked at coauthorship networks in order to examine the potential effect of direct and indirect coauthorship.
Results showed that internationalisation, gender and academic status have significant effects, with the case of gender becoming statistically not significant when the total number of publications was our dependent variable. However, it is important to note that in both models, the Rho was significant. This would indicate that coauthors had similar internationalisation, number of publications and FSS values. This suggests that at least part of our results could be due more to similarities between scientists who were connected to each other than to our independent variables and these models tend to explain only 2-7% of the variance (R2). As discussed in the closing section, further investigation would be necessary to disentangle non-linear effects of collaborations on productivity.
| Research productivity as dependent variable | ||
| FSS | Total Publications | |
| (1) | (2) | |
| Internationalisation | 0.247*** (0.021) | 0.189*** (0.022) |
| Coauthors Stability | 0.093 (0.070) | 0.631*** (0.076) |
| Gender (male) | 0.005 (0.004) | 0.005 (0.004) |
| Associate professor | -0.008* (0.004) | -0.001 (0.005) |
| Full professor | -0.006 (0.005) | 0.004 (0.005) |
| Postdoc | 0.008 (0.007) | 0.020*** (0.007) |
| Constant | 0.016*** (0.005) | 0.023*** (0.005) |
| Observations | 477 | 477 |
| R2 | 0.251 | 0.267 |
| Adjusted R2 | 0.242 | 0.257 |
| Residual Std. Error (df = 470) | 0.040 | 0.043 |
| F Statistic (df = 6; 470) | 26.307*** | 28.470*** |
| Note: | p<0.1; p<0.05; p<0.01 | |
To look at the association between productivity and organisational embeddedness in more detail, we assumed that sociologists working in the same university could be exposed to incentives or local standards more as a group rather than as “separate” individuals. This means the association could be different when considering groups of scientists locally sharing practices and norms rather than scientists as singular individuals (e.g., (Lazega et al. 2008)). For each individual, we assigned the university average score in variables such as international collaborations, the total number of publications and their FSS to rule out differences between sociologists working in the same university (see Table ??). We found confirmation of the fact that collaborating internationally is associated with higher number of publications (model 2) and higher research productivity (model 1). When considering scientists as groups, we found that universities with more internationalized scientists have both higher number of publications and higher level of research productivity. We did not find any statistically significant association between productivity and disciplinary sectors, which seem less important in establishing scientific standards of research, probably being only a “nexus” of academic power (see Table ?? and ?? in the Appendix). Interestingly, we found that groups of sociologists working in economics departments were in general more productive than those working in engineering or humanities departments. This could be due to the higher exposure to robust research, competitive and international standards, which characterize the community of economists. Furthermore, it is worth noting that sociologists rarely work in computer science and electronic departments, in which publication standards are influenced by physics and hard sciences. They often work in departments of civil engineering and architecture, which have publication standards closer to the humanities (e.g., monographs in Italian and priorities to national journals). We also found that group of sociologists in low and medium ranked universities were in general more productive than those working in highly ranked universities. The South-North divide in productivity was also confirmed when looking at the group level (see Table ?? in the Appendix). Finally, we looked at the association between productivity and the variety of coauthors by aggregating group variables. As before, working with more stable coauthors was positively associated with the number of publications (model 2), whereas this was not associated with differences in research productivity also at a group level (model 1).
3.5 Conclusions and discussion
This chapter aimed to study Italian sociologists in their contexts by looking at the influence of certain individual, institutional and contextual factors on productivity. While recent national assessments indicated that productivity of sociologists in Italy is unequally distributed, understanding the sources of these differences required to enlarge the perspective to contextual factors. Looking at institutional and organisational embeddedness could also enrich national assessment exercises, which typically compare scientists irrespective of contextual positive or negative factors (e.g Wilsdon et al. 2015).
First, our findings suggest that internationalisation is key to productivity (F. Narin, Stevens, and Whitlow 1991; Francis Narin and Whitlow 1991; Khor and Yu 2016). By collaborating with colleagues who work in abroad institutions, Italian sociologists are probably more exposed to international standards of research, have higher probability to publish in prestigious journals and are recognized by an international audience (e.g., see the case of Chinese scientists in Jonkers and Tijssen (2008)). However, understanding causal mechanisms that determine the link between internationalisation and productivity would require more in-depth data and analysis, which are out of the scope of this work.
On the one hand, internationalisation is not an exogenous factor as it can be determined by education, pre-established connections, productivity signals and the type of research (Chatzimichael, Kalaitzidakis, and Tzouvelekas 2016). In addition, these factors could also reflect individual propensity and differential investments in international networking, often simply due to inner compulsion or job satisfaction (e.g., (Ramsden 1994; Jung, Bozeman, and Gaughan 2017)). On the other hand, productivity can influence internationalisation in complex ways, such as ensuring access to more funds, which in turn stimulate international contacts, so reflecting non-linear, self-reinforcing complex dynamics (Azoulay, Ganguli, and Zivin 2017). Here, more in-depth data on education, career and institutional ties as well as considering the type of dominant research performed individually could help us provide a more precise understanding of the specific causal mechanisms presiding over the positive link between internationalisation and productivity (Abramo, D’Angelo, and Di Costa 2017).
Secondly, our results suggest that scientific disciplinary sectors seem not to have any implications on scientist productivity. This is interesting as these sectors are extremely influential in the Italian academy for job promotion and career. Scientific associations have been built following their hierarchical structure in which sectorial experts regularly meet and coordinate. Our findings suggest that these sectors seem less relevant to define research standards. They are probably a political and administrative “ontology” rather than an institutional scaffold that establishes research standards and promotes excellence and innovation. This could bring us to re-discuss the importance of disciplinary sectors-dominated hiring or assessment committees, which were also used in national research assessments.
Finally, we found that organisational embeddedness has positive implications on productivity, especially when looking at group level. This would suggest that practices, standards and norms could emerge locally that could influence scientist publication strategies (e.g., Provasi, Squazzoni, and Tosio 2012). However, without considering the differential exposure to more stimulating reward policies locally and the presence of network and learning effects at the organisational level, as well as mobility and career patterns of scientists, it is difficult to understand what characteristics of organisational embeddedness might have a specific effect on productivity. For example, recent research suggested that the presence of particularly brilliant scientists, a higher mobility of scientists and the presence of internationalized educational and research programs could explain higher productivity of groups (Agrawal, McHale, and Oettl 2017). Here, only more in depth analysis of organisational aspects of scientists groups in Italy could help to assess robust effects on productivity. For example, looking at multi-level network effects could help us understanding whether collaboration networks and embeddedness self-reinforce each other in generating effects on productivity.
In conclusion, it is important to highlight that our work has certain limitations, besides those one already mentioned. First, while including the most prestigious Italian journals, Scopus ignores important research that is published in books and monographs by Italian publishers and so is biased towards English language journals and books (near 80 percent of publications here). Unfortunately, we could not compensate by collecting data on Google Scholar (Khabsa and Giles 2014; Meho and Yang 2007), as only a few sociologists in Italy have activated a Google Scholar profile (19.7 %) and these were mostly also those one more extensively covered by Scopus. While extending our findings to Google Scholar would be probably even more relevant to measure sociologists’ productivity (Halevi, Moed, and Bar-Ilan 2017), there are technical difficulties that still make this endeavor extremely costly (e.g., data collection of scientists without Google Scholar profile is hardly automatable on a large scale). However, it is important to note that using different indexes and databases is never neutral as a particular dataset could probably reveal patterns that the other could lead to underestimate (De Stefano et al. 2013). This means that only an integrated analysis could help us to corroborate our findings.
Secondly, while time effects were controlled on citations, our analysis did not consider important temporal aspects, such as the changing academic status of scientists over their career, which could have relevant implications on productivity and important cumulative effects. Unfortunately, the cross-sectional nature of our data did not allow us to fully control for possible endogeneity bias. Further steps of our research will attempt at solving these problems in order to deepen our understanding of the institutional and organisational sources of productivity.
3.6 Appendix
This appendix includes further data and results that complement the analysis shown in the article. In particular, it provides details on our multilevel and macro level models.
3.6.1 Regression models comparision
Table ?? compares different multilevel models that we run with the same random effects structure as those presented in the Table ??. These versions included our institutional embeddedness variables as fixed effects. Results confirmed the importance of academic status (i.e., younger scientists are more productive), certain gender effects and stable coauthorship patterns on the number of publications.
| Model 1 | Model 2 | Model 3 | Model 4 | Model 5 | Model 6 | Model 7 | Model 8 | Model 9 | Model 10 | ||
|---|---|---|---|---|---|---|---|---|---|---|---|
| Constant | -4.03 (0.22)*** | -4.99 (0.67)*** | -4.41 (0.60)*** | -4.10 (0.26)*** | -4.04 (0.28)*** | 0.02 (0.01) | -0.01 (0.06) | 0.03 (0.03) | 0.01 (0.02) | 0.01 (0.02) | |
| Internationalisation | 0.91 (0.34)** | 0.89 (0.34)** | 0.89 (0.34)** | 0.88 (0.34)** | 0.91 (0.33)** | 0.10 (0.02)*** | 0.10 (0.03)*** | 0.10 (0.03)*** | 0.10 (0.03)*** | 0.10 (0.02)*** | |
| Coauthors Stability | 0.12 (0.69) | 0.12 (0.69) | 0.13 (0.69) | 0.08 (0.70) | 0.22 (0.70) | 0.46 (0.05)*** | 0.46 (0.05)*** | 0.46 (0.05)*** | 0.46 (0.05)*** | 0.47 (0.05)*** | |
| Gender (male) | 0.39 (0.14)** | 0.39 (0.14)** | 0.40 (0.14)** | 0.40 (0.14)** | 0.39 (0.14)** | 0.03 (0.01)** | 0.04 (0.01)*** | 0.03 (0.01)** | 0.03 (0.01)** | 0.03 (0.01)** | |
| Associate professor | -0.27 (0.16) | -0.28 (0.16) | -0.25 (0.16) | -0.26 (0.16) | -0.29 (0.16) | 0.02 (0.01) | 0.01 (0.01) | 0.02 (0.01) | 0.02 (0.01) | 0.01 (0.01) | |
| Full professor | -0.38 (0.19)* | -0.39 (0.19)* | -0.37 (0.19)* | -0.39 (0.19)* | -0.41 (0.19)* | 0.03 (0.01)* | 0.03 (0.01)* | 0.04 (0.01)** | 0.03 (0.01)* | 0.03 (0.01)* | |
| Postdoc | 0.99 (0.43)* | 1.95 (0.83)* | 1.01 (0.44)* | 0.99 (0.43)* | 0.93 (0.44)* | 0.10 (0.02)*** | 0.12 (0.09) | 0.10 (0.02)*** | 0.10 (0.02)*** | 0.10 (0.02)*** | |
| Sector SPS/07 | 0.62 (0.81) | 0.02 (0.08) | |||||||||
| Sector SPS/08 | 1.15 (0.81) | 0.03 (0.08) | |||||||||
| Sector SPS/09 | 1.25 (0.82) | 0.04 (0.08) | |||||||||
| Sector SPS/10 | 0.95 (0.85) | 0.02 (0.09) | |||||||||
| Sector SPS/11 | 1.56 (0.87) | 0.01 (0.09) | |||||||||
| Engineering dept. | 0.26 (0.89) | -0.05 (0.05) | |||||||||
| Humanities dept. | 0.43 (0.72) | -0.00 (0.03) | |||||||||
| Medicine dept. | -0.49 (1.01) | -0.02 (0.06) | |||||||||
| Other dept. | -0.29 (0.87) | -0.02 (0.05) | |||||||||
| Psychology dept. | 1.18 (0.97) | -0.00 (0.06) | |||||||||
| Social Sciences dept. | 0.43 (0.71) | -0.02 (0.03) | |||||||||
| Low rank univ. | 0.33 (0.39) | -0.01 (0.03) | |||||||||
| Medium rank univ. | 0.08 (0.23) | 0.01 (0.02) | |||||||||
| Isolated region univ. | -0.13 (0.44) | -0.02 (0.03) | |||||||||
| Northern region univ. | 0.25 (0.26) | 0.03 (0.02) | |||||||||
| Southern region univ. | -0.46 (0.32) | -0.03 (0.02) | |||||||||
| AIC | 1652.31 | 1653.76 | 1656.34 | 1656.84 | 1653.60 | -702.13 | -664.89 | -663.83 | -687.22 | -688.63 | |
| BIC | 1697.66 | 1719.72 | 1726.43 | 1710.43 | 1711.32 | -656.38 | -598.34 | -593.12 | -633.15 | -630.40 | |
| Log Likelihood | -815.15 | -810.88 | -811.17 | -815.42 | -812.80 | 362.07 | 348.44 | 348.91 | 356.61 | 358.31 | |
| Num. obs. | 456 | 456 | 456 | 456 | 456 | 473 | 473 | 473 | 473 | 473 | |
| Num. groups: university | 60 | 60 | 60 | 60 | 60 | 61 | 61 | 61 | 61 | 61 | |
| Num. groups: sector | 7 | 7 | 7 | 7 | 7 | 7 | 7 | 7 | 7 | 7 | |
| Num. groups: department | 7 | 7 | 7 | 7 | 7 | 7 | 7 | 7 | 7 | 7 | |
| Var: university (Intercept) | 0.29 | 0.29 | 0.31 | 0.30 | 0.24 | 0.00 | 0.00 | 0.00 | 0.00 | 0.00 | |
| Var: sector (Intercept) | 0.11 | 0.21 | 0.11 | 0.11 | 0.11 | 0.00 | 0.00 | 0.00 | 0.00 | 0.00 | |
| Var: department (Intercept) | 0.00 | 0.00 | 0.18 | 0.00 | 0.00 | 0.00 | 0.00 | 0.00 | 0.00 | 0.00 | |
| Var: Residual | 1.89 | 1.89 | 1.89 | 1.90 | 1.90 | 0.01 | 0.01 | 0.01 | 0.01 | 0.01 | |
| p < 0.001; p < 0.01; p < 0.05 | |||||||||||
Table ?? (extensions to models presented in Table ??) compares macro level models that ruled out the potential difference between sociologists working in the same universities to see the results between universities. Given that we had a considerable number of these association (78), we wanted to check if this could have biased our analysis. Results suggest that the findings presented in the article were statistically robust.
| Types of research productivity as dependent variable | ||||||||||
| FSS (5 models) | Total Publications (5 models) | |||||||||
| (1) | (2) | (3) | (4) | (5) | (6) | (7) | (8) | (9) | (10) | |
| Internationalisation | 0.247*** (0.021) | 0.247*** (0.021) | 0.256*** (0.021) | 0.227*** (0.021) | 0.243*** (0.021) | 0.189*** (0.022) | 0.187*** (0.022) | 0.195*** (0.023) | 0.186*** (0.023) | 0.156*** (0.020) |
| Gender (male) | 0.005 (0.004) | 0.005 (0.004) | 0.005 (0.004) | 0.005 (0.004) | 0.006 (0.004) | 0.005 (0.004) | 0.005 (0.004) | 0.005 (0.004) | 0.004 (0.004) | 0.003 (0.004) |
| Associate professor | -0.008* (0.004) | -0.008* (0.005) | -0.007 (0.005) | -0.005 (0.004) | -0.009** (0.004) | -0.001 (0.005) | -0.002 (0.005) | -0.001 (0.005) | 0.0004 (0.005) | -0.004 (0.004) |
| Full professor | -0.006 (0.005) | -0.006 (0.005) | -0.005 (0.005) | -0.005 (0.005) | -0.008 (0.005) | 0.004 (0.005) | 0.003 (0.006) | 0.004 (0.006) | 0.004 (0.005) | -0.001 (0.005) |
| Postdoc | 0.008 (0.007) | 0.011 (0.012) | 0.009 (0.006) | 0.008 (0.006) | 0.005 (0.006) | 0.020*** (0.007) | 0.026* (0.013) | 0.020*** (0.007) | 0.020*** (0.007) | 0.011* (0.006) |
| Sector SPS/07 | 0.005 (0.011) | 0.008 (0.012) | ||||||||
| Sector SPS/08 | -0.002 (0.011) | 0.003 (0.012) | ||||||||
| Sector SPS/09 | 0.007 (0.011) | 0.014 (0.012) | ||||||||
| Sector SPS/10 | 0.003 (0.013) | 0.004 (0.014) | ||||||||
| Sector SPS/11 | 0.004 (0.014) | -0.009 (0.015) | ||||||||
| Sector SPS/12 | ||||||||||
| Engineering dept. | -0.036** (0.016) | -0.036** (0.018) | ||||||||
| Humanities dept. | -0.019* (0.010) | -0.024** (0.011) | ||||||||
| Medicine dept. | -0.024 (0.022) | -0.023 (0.024) | ||||||||
| Other dept. | -0.016 (0.016) | -0.021 (0.018) | ||||||||
| Psychology dept. | -0.008 (0.020) | -0.005 (0.022) | ||||||||
| Social Sciences dept. | -0.012 (0.010) | -0.021** (0.011) | ||||||||
| Low rank univ. | 0.031*** (0.009) | -0.001 (0.010) | ||||||||
| Medium rank univ. | 0.019*** (0.004) | 0.013*** (0.004) | ||||||||
| Isolated region univ. | -0.008 (0.010) | -0.010 (0.009) | ||||||||
| Northern region univ. | 0.004 (0.005) | 0.035*** (0.004) | ||||||||
| Southern region univ. | -0.020*** (0.006) | -0.015** (0.006) | ||||||||
| Coauthors Stability | 0.093 (0.070) | 0.101 (0.071) | 0.095 (0.070) | 0.096 (0.068) | 0.089 (0.071) | 0.631*** (0.076) | 0.636*** (0.076) | 0.616*** (0.076) | 0.641*** (0.075) | 0.583*** (0.068) |
| Constant | 0.016*** (0.005) | 0.013 (0.011) | 0.029*** (0.011) | 0.009* (0.005) | 0.019*** (0.006) | 0.023*** (0.005) | 0.017 (0.012) | 0.044*** (0.012) | 0.018*** (0.005) | 0.013** (0.005) |
| Observations | 477 | 477 | 473 | 477 | 477 | 477 | 477 | 473 | 477 | 477 |
| R2 | 0.251 | 0.256 | 0.272 | 0.300 | 0.281 | 0.267 | 0.276 | 0.277 | 0.281 | 0.426 |
| Adjusted R2 | 0.242 | 0.238 | 0.253 | 0.288 | 0.267 | 0.257 | 0.259 | 0.258 | 0.269 | 0.415 |
| Residual Std. Error | 0.040 | 0.040 | 0.040 | 0.039 | 0.039 | 0.043 | 0.043 | 0.043 | 0.043 | 0.038 |
| F Statistic | 26.307*** | 14.507*** | 14.348*** | 25.039*** | 20.268*** | 28.470*** | 16.135*** | 14.662*** | 22.908*** | 38.530*** |
| Note: | p<0.1; p<0.05; p<0.01 | |||||||||
3.6.2 Negative Binomial models
In order to control robustness of our results with alternative modelling strategies, we ran negative binomial models on the total publication as dependent variable which has a count nature and highly skewed distribution (see Table ??). Results were in line with our crossed membership multi-level models presented in Tables ?? and ?? that were using total publication scaled to 0-1 (we kept the same random effects structure as presented before). Only postdocs when counted the number of publications (instead of scaled version used in previous models) show lower total publications compare to assistant professors which is natural. Because the scaling was based on the distributions of all publications of postdocs. Interestingly, university membership has the highest share of variance split by groups in the random effects table (see rows below the table starting with Var).
| Model 1 | Model 2 | Model 3 | Model 4 | Model 5 | ||
|---|---|---|---|---|---|---|
| Constant | 1.13 (0.10)*** | 0.96 (0.22)*** | 1.25 (0.22)*** | 1.09 (0.13)*** | 1.08 (0.13)*** | |
| Internationalisation | 0.98 (0.18)*** | 0.98 (0.18)*** | 0.98 (0.18)*** | 0.98 (0.18)*** | 1.00 (0.18)*** | |
| Coauthors Stability | 3.31 (0.43)*** | 3.35 (0.43)*** | 3.29 (0.42)*** | 3.32 (0.42)*** | 3.33 (0.42)*** | |
| Gender (male) | 0.22 (0.07)** | 0.23 (0.07)** | 0.22 (0.07)** | 0.22 (0.07)** | 0.21 (0.07)** | |
| Associate professor | 0.17 (0.09)* | 0.17 (0.09) | 0.18 (0.09)* | 0.17 (0.09)* | 0.16 (0.08) | |
| Full professor | 0.36 (0.09)*** | 0.34 (0.09)*** | 0.37 (0.09)*** | 0.36 (0.09)*** | 0.33 (0.09)*** | |
| Postdoc | -0.54 (0.13)*** | -0.38 (0.23) | -0.54 (0.13)*** | -0.54 (0.13)*** | -0.58 (0.13)*** | |
| Sector SPS/07 | 0.13 (0.20) | |||||
| Sector SPS/08 | 0.21 (0.20) | |||||
| Sector SPS/09 | 0.28 (0.21) | |||||
| Sector SPS/10 | 0.04 (0.24) | |||||
| Sector SPS/11 | -0.05 (0.26) | |||||
| Engineering dept. | -0.41 (0.38) | |||||
| Humanities dept. | -0.04 (0.21) | |||||
| Medicine dept. | -0.11 (0.43) | |||||
| Other dept. | -0.41 (0.37) | |||||
| Psychology dept. | -0.00 (0.41) | |||||
| Social Sciences dept. | -0.16 (0.21) | |||||
| Low rank univ. | -0.07 (0.23) | |||||
| Medium rank univ. | 0.09 (0.14) | |||||
| Isolated region univ. | -0.24 (0.24) | |||||
| Northern region univ. | 0.31 (0.13)* | |||||
| Southern region univ. | -0.30 (0.17) | |||||
| AIC | 2535.10 | 2539.91 | 2543.52 | 2538.41 | 2524.80 | |
| BIC | 2580.85 | 2606.45 | 2614.23 | 2592.48 | 2583.02 | |
| Log Likelihood | -1256.55 | -1253.95 | -1254.76 | -1256.21 | -1248.40 | |
| Num. obs. | 473 | 473 | 473 | 473 | 473 | |
| Num. groups: university | 61 | 61 | 61 | 61 | 61 | |
| Num. groups: sector | 7 | 7 | 7 | 7 | 7 | |
| Num. groups: department | 7 | 7 | 7 | 7 | 7 | |
| Var: university (Intercept) | 0.13 | 0.12 | 0.12 | 0.13 | 0.07 | |
| Var: sector (Intercept) | 0.00 | 0.00 | 0.00 | 0.00 | 0.00 | |
| Var: department (Intercept) | 0.00 | 0.00 | 0.00 | 0.00 | 0.00 | |
| p < 0.001; p < 0.01; p < 0.05 | ||||||
References
Shapin, Steven. 2009. The Scientific Life: A Moral History of a Late Modern Vocation. University of Chicago Press.
Katz, J. S., and B. R. Martin. 1997. “What Is Research Collaboration?” Research Policy 26 (1): 1–18.
Lamont, Michèle. 2009. How Professors Think. Harvard University Press.
Bland, Carole J, Mack T Ruffin, and others. 1992. “Characteristics of a Productive Research Environment: Literature Review.” Academic Medicine 67 (6): 385–97.
Provasi, Giancarlo, Flaminio Squazzoni, and Beatrice Tosio. 2012. “Did They Sell Their Soul to the Devil? Some Comparative Case-Studies on Academic Entrepreneurs in the Life Sciences in Europe.” Higher Education 64 (6): 805–29.
Abramo, Giovanni, and Ciriaco Andrea D’Angelo. 2011b. “National-Scale Research Performance Assessment at the Individual Level.” Scientometrics 86 (2): 347–64. https://doi.org/10.1007/s11192-010-0297-2.
Beerkens, Maarja. 2013. “Facts and Fads in Academic Research Management: The Effect of Management Practices on Research Productivity in Australia.” Research Policy 42 (9): 1679–93.
Rijcke, Sarah de, Paul F Wouters, Alex D Rushforth, Thomas P Franssen, and Björn Hammarfelt. 2016. “Evaluation Practices and Effects of Indicator Use—a Literature Review.” Research Evaluation 25 (2): 161–69.
Timmermans, Stefan, and Steven Epstein. 2010. “A World of Standards but Not a Standard World: Toward a Sociology of Standards and Standardization.” Annual Review of Sociology 36: 69–89.
Wilsdon, J, L Allen, E Belfiore, P Campbell, S Curry, S Hill, R Jones, et al. 2015. “The Metric Tide: Report of the Independent Review of the Role of Metrics in Research Assessment and Management. HEFCE.”
Burrows, Roger. 2012. “Living with the H-Index? Metric Assemblages in the Contemporary Academy.” The Sociological Review 60 (2): 355–72.
Hicks, Diana, Paul Wouters, Ludo Waltman, Sarah De Rijcke, and Ismael Rafols. 2015. “The Leiden Manifesto for Research Metrics.” Nature 520 (7548): 429.
Edwards, Marc A, and Siddhartha Roy. 2017. “Academic Research in the 21st Century: Maintaining Scientific Integrity in a Climate of Perverse Incentives and Hypercompetition.” Environmental Engineering Science 34 (1): 51–61.
Weick, Karl E. 2016. “Perspective Construction in Organizational Behavior.” Annual Review of Organizational Psychology and Organizational Behavior, no. 0.
Whitley, Richard. 2003. “Competition and Pluralism in the Public Sciences: The Impact of Institutional Frameworks on the Organisation of Academic Science.” Research Policy 32 (6): 1015–29.
Berlemann, Michael, and Justus Haucap. 2015. “Which Factors Drive the Decision to Opt Out of Individual Research Rankings? An Empirical Study of Academic Resistance to Change.” Research Policy 44 (5): 1108–15.
Stergiou, Konstantinos I, and Stephan Lessenich. 2014. “On Impact Factors and University Rankings: From Birth to Boycott.” Ethics in Science and Environmental Politics 13 (2): 101–11.
Leydesdorff, L., H. W. Park, and C. Wagner. 2014. “International Coauthorship Relations in the Social Sciences Citation Index: Is Internationalization Leading the Network?” Journal of the Association for Information Science and Technology 65 (10): 2111–26.
Hakala, Johanna, and Oili-Helena Ylijoki. 2001. “Research for Whom? Research Orientations in Three Academic Cultures.” Organization 8 (2): 373–80.
ANVUR. 2013. “ANVUR Rapporto Finale Vqr - Last Accessed 20 July 2018.” http://www.anvur.org/rapporto/.
Turri, Matteo. 2014. “The New Italian Agency for the Evaluation of the University System (Anvur): A Need for Governance or Legitimacy?” Quality in Higher Education 20 (1): 64–82.
Geuna, Aldo, and Matteo Piolatto. 2016. “Research Assessment in the Uk and Italy: Costly and Difficult, but Probably Worth It (at Least for a While).” Research Policy 45 (1): 260–71.
Baccini, Alberto, and Giuseppe De Nicolao. 2016. “Do They Agree? Bibliometric Evaluation Versus Informed Peer Review in the Italian Research Assessment Exercise.” Scientometrics 108 (3): 1651–71.
Bellotti, Elisa, Luka Kronegger, and Luigi Guadalupi. 2016. “The Evolution of Research Collaboration Within and Across Disciplines in Italian Academia.” Scientometrics 109 (2): 783–811. https://doi.org/10.1007/s11192-016-2068-1.
Bellotti, Elisa, Luigi Guadalupi, and Guido Conaldi. 2016. “Comparing Fields of Sciences: Multilevel Networks of Research Collaborations in Italian Academia.” In Multilevel Network Analysis for the Social Sciences, 213–44. Springer.
Abramo, Giovanni, Ciriaco Andrea D’Angelo, and Francesco Rosati. 2016b. “The North–South Divide in the Italian Higher Education System.” Scientometrics 109 (3): 2093–2117. https://doi.org/10.1007/s11192-016-2141-9.
Abramo, Giovanni, and Ciriaco Andrea D’Angelo. 2014b. “How Do You Define and Measure Research Productivity?” Scientometrics 101 (2): 1129–44. https://doi.org/10.1007/s11192-014-1269-8.
Nederhof, Anton J. 2006. “Bibliometric Monitoring of Research Performance in the Social Sciences and the Humanities: A Review.” Scientometrics 66 (1): 81–100.
Pepe, Alberto, and Michael J Kurtz. 2012. “A Measure of Total Research Impact Independent of Time and Discipline.” PLoS One 7 (11): e46428.
Hirsch, Jorge E. 2005. “An Index to Quantify an Individual’s Scientific Research Output.” Proceedings of the National Academy of Sciences of the United States of America, 16569–72.
Egghe, Leo. 2010. “The Hirsch Index and Related Impact Measures.” Annual Review of Information Science and Technology 44 (1): 65–114.
Hirsch, Jorge E. 2010. “An Index to Quantify an Individual’s Scientific Research Output That Takes into Account the Effect of Multiple Coauthorship.” Scientometrics 85 (3): 741–54.
Batista, Pablo D, Mônica G Campiteli, and Osame Kinouchi. 2006. “Is It Possible to Compare Researchers with Different Scientific Interests?” Scientometrics 68 (1): 179–89.
Ellwein, Leon B, M Khachab, and RH Waldman. 1989. “Assessing Research Productivity: Evaluating Journal Publication Across Academic Departments.” Academic Medicine 64 (6): 319–25.
Fox, Mary Frank. 1983. “Publication Productivity Among Scientists: A Critical Review.” Social Studies of Science 13 (2): 285–305.
Ramsden, Paul. 1994. “Describing and Explaining Research Productivity.” Higher Education 28 (2): 207–26.
Bland, Carole J, Elizabeth Seaquist, James T Pacala, Bruce Center, and Deborah Finstad. 2002. “One School’s Strategy to Assess and Improve the Vitality of Its Faculty.” Academic Medicine 77 (5): 368–76.
Bland, Carole J, Bruce A Center, Deborah A Finstad, Kelly R Risbey, and Justin G Staples. 2005. “A Theoretical, Practical, Predictive Model of Faculty and Department Research Productivity.” Academic Medicine 80 (3): 225–37.
Nygaard, Lynn P. 2015. “Publishing and Perishing: An Academic Literacies Framework for Investigating Research Productivity.” Studies in Higher Education, 1–14.
Long, J Scott, and Robert McGinnis. 1981. “Organizational Context and Scientific Productivity.” American Sociological Review, 422–42.
Blackburn, Robert T, Charles E Behymer, and David E Hall. 1978. “Research Note: Correlates of Faculty Publications.” Sociology of Education, 132–41.
Long, J Scott. 1978. “Productivity and Academic Position in the Scientific Career.” American Sociological Review, 889–908.
Lazega, Emmanuel, Marie-Thérèse Jourda, Lise Mounier, and Rafaël Stofer. 2008. “Catching up with Big Fish in the Big Pond? Multi-Level Network Analysis Through Linked Design.” Social Networks 30 (2): 159–76.
Kronegger, Luka, Franc Mali, Anuška Ferligoj, and Patrick Doreian. 2011. “Collaboration Structures in Slovenian Scientific Communities.” Scientometrics 90 (2): 631–47.
Price, D. J. de Solla. 1970. “Citation Measures of Hard Science, Soft Science, Technology, and Nonscience.” In Communication Among Scientists and Engineers, edited by C. E. Nelson and D. K. Pollock, 3–22. Lexington, MA: Heath.
Abramo, Giovanni, Ciriaco Andrea D’Angelo, and Francesco Rosati. 2016a. “A Methodology to Measure the Effectiveness of Academic Recruitment and Turnover.” Journal of Informetrics 10 (1): 31–42.
ANVUR. 2014. “Confronto Tra Dimensione E Qualita Delle Strutture Universita.” http://www.anvur.org/rapporto/stampa.php.
Abramo, Giovanni, Ciriaco Andrea D’Angelo, and Flavia Di Costa. 2011. “Research Productivity: Are Higher Academic Ranks More Productive Than Lower Ones?” Scientometrics 88 (3): 915–28.
Abramo, Giovanni, Tindaro Cicero, and Ciriaco Andrea D’Angelo. 2013. “Individual Research Performance: A Proposal for Comparing Apples to Oranges.” Journal of Informetrics 7 (2): 528–39. https://doi.org/10.1016/j.joi.2013.01.013.
Opthof, Tobias, and Loet Leydesdorff. 2010. “Caveats for the Journal and Field Normalizations in the CWTS (‘Leiden’) Evaluations of Research Performance.” Journal of Informetrics 4 (3): 423–30. https://doi.org/10.1016/j.joi.2010.02.003.
Becher, Tony, and Paul Trowler. 2001. Academic Tribes and Territories: Intellectual Enquiry and the Culture of Disciplines. McGraw-Hill Education (UK).
Smith, Mapheus. 1958. “The Trend Toward Multiple Authorship in Psychology.” American Psychologist 13 (10): 596.
Rumsey, Anne R. 2006. “The Association Between Co-Authorship Network Structures and Successful Academic Publishing Among Higher Education Scholars.”
Kuzhabekova, Aliya. 2011. “Impact of Co-Authorship Strategies on Research Productivity: A Social-Network Analysis of Publications in Russian Cardiology.” PhD thesis, University of Minnesota.
Csardi, G., and T. : Nepusz. 2006. “The Igraph Software Package for Complex Network Research.” InterJournal, Complex Systems 1695. http://igraph.org.
Baayen, R Harald, Douglas J Davidson, and Douglas M Bates. 2008. “Mixed-Effects Modeling with Crossed Random Effects for Subjects and Items.” Journal of Memory and Language 59 (4): 390–412.
Snijders, TAB, and Roel Bosker. 1999. “Multilevel Analysis: An Introduction to Basic and Advanced Multilevel Modeling.” London: Sage.
Faraway, Julian L. 2005. “Extending the Linear Model with R: Gerenalized Linear, Mixed Effects and Nonparametric Regression Models.” In. CRC PRESS.
Zuur, AF, EN Ieno, NJ Walker, AA Saveliev, and GM Smith. 2009. “Mixed Effects Models and Extensions in Ecology with R. Gail M, Krickeberg K, Samet Jm, Tsiatis a, Wong W, Editors.” New York, NY: Spring Science and Business Media.
Hâncean, Marian-Gabriel, and Matjaž Perc. 2016. “Homophily in Coauthorship Networks of East European Sociologists.” Scientific Reports 6.
Abramo, Giovanni, Ciriaco Andrea D’Angelo, and Alessandro Caprasecca. 2009b. “Gender Differences in Research Productivity: A Bibliometric Analysis of the Italian Academic System.” Scientometrics 79 (3): 517–39.
Coile, Russell C. 1977. “Lotka’s Frequency Distribution of Scientific Productivity.” Journal of the American Society for Information Science 28 (6): 366–70.
Bornmann, Lutz. 2010. “Towards an Ideal Method of Measuring Research Performance: Some Comments to the Opthof and Leydesdorff (2010) Paper.” Journal of Informetrics 4 (3): 441–43. https://doi.org/10.1016/j.joi.2010.04.004.
Garfield, Eugene. 1980. “Premature Discovery or Delayed Recognition-Why.” Current Contents, no. 21: 5–10.
Abramo, Giovanni, Ciriaco Andrea D’Angelo, and Flavia Di Costa. 2008. “Assessment of Sectoral Aggregation Distortion in Research Productivity Measurements.” Research Evaluation 17 (2): 111–21. http://rev.oxfordjournals.org/content/17/2/111.short.
Narin, F., K. Stevens, and E. Whitlow. 1991. “Scientific Co-Operation in Europe and the Citation of Multinationally Authored Papers.” Scientometrics 21 (3): 313–23.
Narin, Francis, and Edith S Whitlow. 1991. Measurement of Scientific Cooperation and Coauthorship in Cec-Related Areas of Science. Commission of the European Communities Directorate-General Telecommunications, Information Industries; Innovation.
Khor, K. A., and L. G. Yu. 2016. “Influence of International Coauthorship on the Research Citation Impact of Young Universities.” Scientometrics 107 (3): 1095–1110.
Prpić, Katarina. 2002. “Gender and Productivity Differentials in Science.” Scientometrics 55 (1): 27–58.
Hancock, Kathleen J, and Matthew Baum. 2010. “Women and Academic Publishing: Preliminary Results from a Survey of the Isa Membership.” In The International Studies Association Annual Convention, New Orleans, La.
Stack, Steven. 2004. “Gender, Children and Research Productivity.” Research in Higher Education 45 (8): 891–920.
Burt, Ronald S. 2005. Brokerage and Closure: An Introduction to Social Capital. Oxford university press.
Leenders, Roger Th AJ. 2002. “Modeling Social Influence Through Network Autocorrelation: Constructing the Weight Matrix.” Social Networks 24 (1): 21–47.
Butts, Carter T. 2016. Sna: Tools for Social Network Analysis. https://CRAN.R-project.org/package=sna.
Jonkers, K., and R. Tijssen. 2008. “Chinese Researchers Returning Home: Impacts of International Mobility on Research Collaboration and Scientific Productivity.” Scientometrics 77 (2): 309–33.
Chatzimichael, Konstantinos, Pantelis Kalaitzidakis, and Vangelis Tzouvelekas. 2016. “Measuring the Publishing Productivity of Economics Departments in Europe.” Scientometrics, 1–20.
Jung, Jiwon, Barry Bozeman, and Monica Gaughan. 2017. “Impact of Research Collaboration Cosmopolitanism on Job Satisfaction.” Research Policy.
Azoulay, Pierre, Ina Ganguli, and Joshua Graff Zivin. 2017. “The Mobility of Elite Life Scientists: Professional and Personal Determinants.” Research Policy 46 (3): 573–90.
Abramo, Giovanni, Ciriaco Andrea D’Angelo, and Flavia Di Costa. 2017. “The Effects of Gender, Age and Academic Rank on Research Diversification.” Scientometrics, 1–15.
Agrawal, Ajay, John McHale, and Alexander Oettl. 2017. “How Stars Matter: Recruiting and Peer Effects in Evolutionary Biology.” Research Policy 46 (4): 853–67.
Khabsa, Madian, and C Lee Giles. 2014. “The Number of Scholarly Documents on the Public Web.” PloS One 9 (5): e93949.
Meho, Lokman I, and Kiduk Yang. 2007. “Impact of Data Sources on Citation Counts and Rankings of Lis Faculty: Web of Science Versus Scopus and Google Scholar.” Journal of the Association for Information Science and Technology 58 (13): 2105–25.
Halevi, Gali, Henk Moed, and Judit Bar-Ilan. 2017. “Suitability of Google Scholar as a Source of Scientific Information and as a Source of Data for Scientific Evaluation—Review of the Literature.” Journal of Informetrics 11 (3): 823–34.
De Stefano, Domenico, Vittorio Fuccella, Maria Prosperina Vitale, and Susanna Zaccarin. 2013. “The Use of Different Data Sources in the Analysis of Co-Authorship Networks and Scientific Performance.” Social Networks 35 (3): 370–81.
A slightly different version of this chapter has been published in Akbaritabar, Casnici, and Squazzoni (2018)↩
“Agenzia Nazionale di Valutazione del Sistema Universitario e della Ricerca”↩
Scientific disciplinary sectors established by MIUR: “General sociology, Sociology of culture and communication, Economic sociology, Environmental sociology, Political sociology and Sociology of law and social change”↩
In order to ensure the full correspondence between MIUR and Scopus records, we not only automatically checked the correspondence with MIUR names and Scopus profile with multiple criteria and step-by-step procedures. We also cross-checked manually each conflicting or absent case by a group of three independent assistants. As emphasized by (Abramo and D’Angelo 2011b; Pepe and Kurtz 2012; De Stefano et al. 2013), this is a time consuming and hard task but is the only way to reduce mistakes, also sometimes due to surname changes (e.g., marriage or divorce) and homonyms.↩
To do so we wrote an R Core Team (2016) script that interacted with Scopus API. First, we searched each of these authors’ last and first names in Scopus to see if they had official profiles. When available, we extracted all publications records of these authors throughout their scientific career. We started data gathering by sending search queries to Scopus API on July 27th 2016, while from September 8th 2016 we started gathering Scopus CSV exports of all available information on publications for each author through Scopus web interface to build links with data from API interface and cover up differences and shortages. To manipulate the data and modeling it, we have used Base (2016), Dplyr (2016), Igraph (2006), lme4 (2015), stargazer (2015), ggplot2 (2009) and Stringdist (2014) packages in R to write data cleaning and statistical analysis procedures.↩
In the models presented in Tables ?? and ?? we used logarithmic transformation of FSS since its distribution was highly skewed, as presented in Figure 3.2.↩
Elaborated models with these variables are included in the appendix (Table ?? and ??). Note that we did not present models including impact factor of journals in FSS as their results were in line with those presented here.↩