Chapter 6 Italian sociology: A community of disconnected groups26
Abstract
Examining coauthorship networks is key to study scientist collaboration patterns and structural characteristics of scientific communities. This requires temporal and multi-level quantitative analysis. Here, we focus on coauthorship networks of sociologists in Italy, which were under-studied so far. By looking at publications indexed in Scopus, we detect the largest and most stable research communities in Italian sociology. We found that Italian sociologists are fractured in many disconnected groups, but two prominent communities are formed by economic and political sociologists around certain research topics. By applying an exponential random graph model, we found that collaboration ties were mainly driven by the research focus. However, other factors, such as preferential attachment, gender and affiliation homophily were also important. Our findings show that political sociologists tend to be more international. Our research shows the advantages of multi-level and temporal network analysis in revealing the complexity of scientific collaboration patterns.
Keywords: Italian sociologists; Coauthorship networks evolution; Temporal community detection; Preferential attachment; ERGM
6.1 Introduction
Connections between scientists are key to scientific progress (Garvey 1979; Zhang et al. 2018). Teamwork is instrumental to science today more than ever and this is true in both hard and social sciences (Wuchty, Jones, and Uzzi 2007). Larger collaboration networks increase the number of publications and citations, which are key for tenure and promotion in academia (Leahey, Keith, and Crockett 2010; Long 1992; Grant and Ward 1991), not to mention the probability of receiving grants from funding agencies (Edwards and Roy 2017; Nederhof 2006). In addition, collaboration is also key to recognition and academic reputation (Merton 1968).
Quantitative analysis of coauthorship ties from scientific publications has been one of the most important means to study scientific collaboration (Katz and Martin 1997; Batagelj, Ferligoj, and Squazzoni 2017). This type of study reveals conditions and effects of collaboration across a wide spectrum of scientific activities, ranging from grant proposal to funding (Sciabolazza et al. 2017; Bellotti, Kronegger, and Guadalupi 2016). Studying coauthorship networks can also reveal the structure of scientific community, the evolution of its epistemic field, the degree of cohesiveness or fragmentation and the co-existence of competing paradigms and communities.
In an influential article Moody (2004) questioned whether sociology became more socially integrated in the last decades. He examined coauthorship networks of sociologists using all sociological abstracts in English language from 1963 to 1999, amounting to 197,976 abstracts. He evaluated three competing hypotheses on the nature of scientific collaborations in sociology: 1) Collaboration represents a small world of distant communities of sociologists focusing on their substantive research areas, while scholars are connected through short paths; 2) A large periphery of scholars gathered around a core of a few star scientists; or 3) A structurally cohesive network, based on Abbott (2001), with wide-ranging collaboration between different specialists. He argued that the peculiar position of sociology, which has always been surrounded by adjacent disciplines and idea spaces, could make it permeable to external theories, methods and concepts, making wide-ranging collaborations especially around quantitative research probable.
Moody (2004) found that sociology was characterized by a structurally cohesive core, which has grown steadily over the time. Collaboration depended on research specialization with quantitative researchers engaging more in collaboration. Finally, Moody suggested that a scientist’s probability of being embedded in the core network depended more on collaboration trajectories than on his or her specialty.
Sciabolazza et al. (2017) used a modularity algorithm (Newman and Girvan 2004) to examine coauthorship networks between scholars at the University of Florida in 2013-2015. They used an exponential random graph model (ERGM) and found that similar institutional affiliation, spatial proximity, transitivity effects, and use of similar research services provided by the university predicted higher collaboration.
Zhang et al. (2018) recently proposed an interesting ERGM specification that is relevant for studying coauthorship networks. They analyzed different factors influencing coauthorship tie formation, including homophily, transitivity and preferential attachment by looking at 633 prolific authors in computer science. Tie formation was found to be a complex process, which is often dominated by transitivity (the tendency of authors to collaborate with their coauthors’ collaborators is strong) and preferential attachment (the more coauthors one has, the more new collaborators (s)he will attract). These factors contribute to the so-called “Matthew effect”, leading to non-linear, cumulative processes of academic recognition and prestige (Merton 1968).
The case of sociology is interesting. While sociologists collaborate more than humanities scholars and less than physicists (Babchuk, Keith, and Peters 1999), they are fragmented in small groups with weak epistemic and methodological coherence and with a contested subject (Abbott (2000), Abbott (2001); Turner (2006)). The lack of prominent and paradigmatic figures in the field (Wallerstein (2000); Hargens (2004)) and the competition with other specialists, such as economists and political scientists (Wallerstein 2000), could lead to complex collaboration patterns. Furthermore, the case of Italian sociologists is of special interest, considering the limited size of the community and its fracture between more internationalized and more local scholars (Akbaritabar, Casnici, and Squazzoni 2018).
We first construct the coauthorship network based on publications indexed in Scopus with a “complete” or “sociocentric” (Marsden 2002) network approach. Uncovering patterns in these coauthorship networks requires advanced quantitative analysis. Here, we followed Sciabolazza et al. (2017) to detect research communities and Zhang et al. (2018) in using an ERGM (Lusher, Koskinen, and Robins 2013). We build on previous research on Italian sociologists Akbaritabar, Casnici, and Squazzoni (2018); Bellotti, Kronegger, and Guadalupi (2016)), and use a multi-level approach (Lazega et al. 2008). We used a sophisticated model to check interaction between different factors in our findings and that allows us to control for individual scientist attributes, along with covariate attributes, communities and network level characteristics.
With this multi-level design, we analyze whether Italian sociologists tended to collaborate preferably with well-known and more prolific colleagues (preferential attachment), with colleagues of their same gender (gender homophily), and with their same affiliation country (affiliation homophily). Furthermore, we analyzed whether they were inclined to collaborate more preferably with colleagues with the same research productivity level and working on the same substantive focus.
The structure of the chapter is as follows: In Section 2, we present our data and methods. In Section 3 we present our findings, while we discuss our main results in Section 4.
6.2 Data & Method
We gathered data from the website of the Italian Ministry of Education, Universities and Research (MIUR) for all currently hired sociologists in Italian universities and research centers. This included information about the subject’s current academic position (i.e., assistant, associate or full professor), the “scientific disciplinary sector”27 in which s/he has been formally assigned (e.g., political sociology, economic sociology etc.), gender, affiliation, department, and last and first name (Akbaritabar, Casnici, and Squazzoni 2018).
We then extracted all publications by Italian sociologists (3,168 papers) from Scopus in September 201628. Data included articles’ title, keywords, abstract, publication year, authors’ names and affiliations, and number of citations received. Figure 6.1 shows the growth in number of publications in all journals over time.
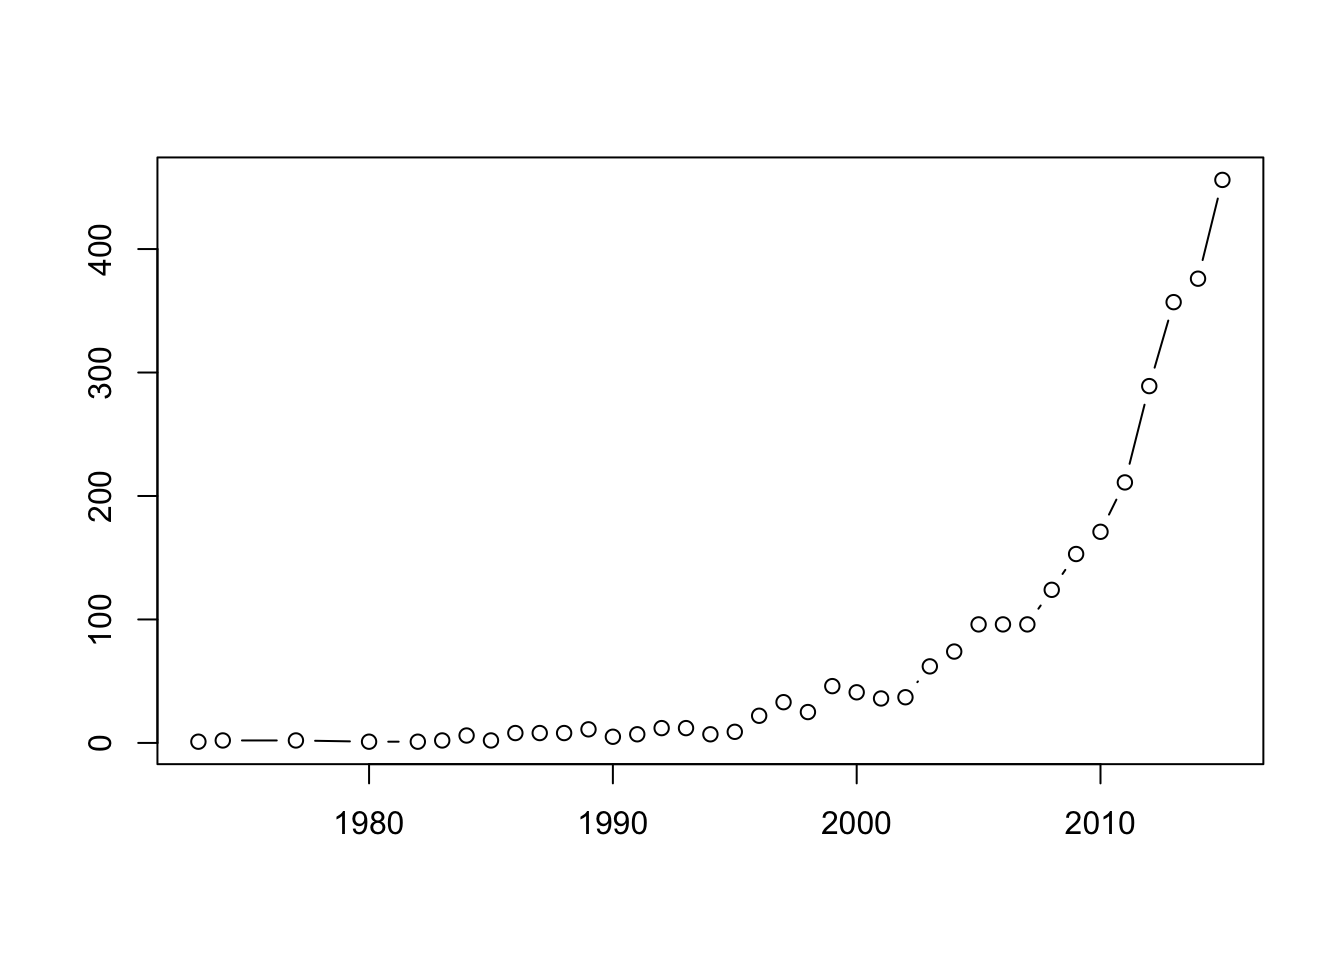
Figure 6.1: Distribution of the total number of publications 1973-2015 (Scopus data) The x-axis denotes the years, the y-axis denotes the number of publications
For authors whose gender was missing from the website, we searched for an online profile and photo. After careful checking, only 15 cases with missing gender remained. We also aggregated each author’s country of affiliation at the continental level.
We constructed a coauthorship network from articles as undirected ties with equal weights for any coauthorships, even those repeated later in the data (Newman 2001a, 2001b). This is the projection of the bipartite network of the ties between authors and papers. We used Scopus’s author identification numbers29 to treat name disambiguation (De Stefano et al. 2013). We looked at all publications of sociologists in the list, extracted from MIUR website. We collected their collaborations with scientists outside Italy or in other fields of science. However, we did not collect the full publication list for each of their collaborators. This implies that these collaborators existed in the coauthorship network only because they coauthored an article (or more) with an Italian sociologist.
6.2.1 Temporal Community Detection
In order to detect coauthor communities, we used a temporal community detection (Mucha et al. 2010) as implemented in the louvain-igraph (Traag 2015) library in Python (see here for how-to-use and technical descriptions). This library allows to apply different community detection methods on network graphs as elaborated in Traag (2014). We specifically used Constant Potts model (CPM) (Traag, Van Dooren, and Nesterov 2011), which is a specific version of the more general Potts model suggested by Reichardt and Bornholdt (2004). CPM was proposed by Traag, Van Dooren, and Nesterov (2011) as a resolution-limit-free method to overcome the resolution limit in modularity (Newman and Girvan 2004) and other methods for community detection. This limit impedes the detection of small communities in large networks and affects the efficiency of the community detection. The idea of community detection principally emphasizes the importance of links “within” communities rather than those “between” them. CPM introduces a \(\gamma\) parameter, i.e. the “constant” in the name, leading to communities such that the link density between the communities (external density) is lower than \(\gamma\) and the link density within communities (internal density) is higher than \(\gamma\) (Traag, Van Dooren, and Nesterov 2011). Note that \(\gamma\) is the resolution parameter helping CPM to be a resolution-limit-free method. This allows us to detect communities with a particular density and size through the time using the parameters described in Table 6.1.
We divided the cross-sectional graph of all coauthorship ties by each year between 1973 and 2017, for a total of 44 yearly graphs. Each author was included in the yearly co-authorship networks from the year of the first until the year of the last personal publication. This means that authors can appear in a the community even though they had not published in that specific year. This allowed us to consider all active authors and prevents someone being intermittently included and excluded from the network due to lack of publications in a specific year. Each node representing an author in year t was connected to itself with an inter-slice tie. Finally, the whole graph was is the aggregation of all these intra-slice ties (i.e., coauthorships occurring in any particular year) and inter-slice ties (i.e., ties connecting the same author across years). We then applied temporal community detection to this full graph (Mucha et al. 2010).
Table 6.1 presents the two main parameters affecting the temporal community detection, the resolution parameter and the inter-slice weight. Varying these parameters allowed us to detect communities of different size and different stability over time. After checking, we set the resolution (i.e., \(\gamma\), the density of communities in CPM) to \(2 \times 10^{-2}\) and inter-slice weight to 1. Note that the inter-slice weight controls the level of dynamics between the communities, i.e., how much authors’ movement is allowed. This means that authors could leave a community and join another one in this 44 years period. This particular configuration gave us the two largest and most stable communities in the giant component over time.
| Inter-slice Weight | |||
|---|---|---|---|
| High | Low | ||
| Resolution Parameter | High | Smaller Communities - More stable | Smaller Communities - Less stable |
| Low | Bigger Communities - More stable | Bigger Communities - Less stable |
6.2.2 Visualization techniques: Alluvial plots and substantive focus with term maps
Alluvial plots are one of the most expressive visualization methods to represent change in large temporal networks (Rosvall and Bergstrom 2010). It uses ribbons over a bar plot of time (e.g., years) to represent the flow of information, nodes, resources and the like among different groups over time. Here, we presented communities as blocks of authors with different colors. The height of each block shows the size of the community. Whenever authors change their membership and join another coauthorship community, their color changes in the plot and they join another block which is presented with mergers and splits in the ribbons linking blocks at different years. Vice versa, following an author’s individual ribbon shows their inter-community movement. This allowed us to see the flow of authors among coauthorship communities. Ribbons connecting to the author in each year from previous years (being still present in the stacked bar) which does not follow into subsequent years would indicate inactivity in publication, i.e. due to retirement from academia, or publications in sources which are not indexed in Scopus.
In order to study the substantive focus of publications, we used VOSviewer, a software tool developed by Van Eck and Waltman (2010). This allowed us to parse corpora of text, detect terms, i.e., noun-phrases, using natural language processing and obtain a term map visualization based on the VOS layout algorithm (Eck et al. 2010). The distance between terms in this map reflects co-occurrence of such terms in documents: more frequently co-occurring terms tend to appear close to each other. Additionally, this tool clusters terms together. In our case, we also considered author level characteristics (e.g., coauthorship communities’ membership, country of affiliation, first and last publication dates as proxy of academic career trajectories) to understand substantive focus of research. For example, we overlaid the coauthorship communities found by the temporal community detection method on top of the substantive term maps to see if they corresponded to research specialization.
6.2.3 Exponential Random Graph Model
Finally, we used Exponential Random Graph Models (ERGMs) to simulate networks based on the giant component of Italian sociologists and their coauthors network, i.e. our observed network (Lusher, Koskinen, and Robins 2013). This provided a baseline to estimate if our coauthorship network was reflecting unique characteristics compared to what we would expect from a distribution of random networks.
Furthermore, ERGMs allowed us to consider different types of attributes while modelling the probability of tie existence in the network. Node attributes included certain authors properties such as academic seniority, gender and continental region of affiliation. Covariate attributes allowed us to control and compare two nodes on the two ends of an edge for similarity or differences of attributes. This allowed us to control for homophily effects in our network (e.g., Bianchi, Casnici, and Squazzoni (2018)). Furthermore, ERGMs enabled us to check structural effects such as preferential attachment (by degree distribution), thereby considering possible Matthew effects (Merton 1968), i.e., cumulative advantage in collaborations. This mix of nodal and structural attributes in one integrated model was of paramount importance to map tie existence more effectively.
6.3 Results
Figure 6.2 shows the coauthorship network of all Italian sociologists and their coauthors with affiliation of authors indicated by node colors. Ties are colored based on being within or between the affiliation groups. we found that Italian sociologists (1,641 out of 2,747 total) are mostly connected by intermediation of coauthors affiliated elsewhere (see gray nodes on Figure 6.2; see below for detail on this). Table 6.2 shows the main features of this network. The sparse coauthorship relations (Average degree = 5.5) with relatively high number of connected components (512) indicate the level of disconnectedness of the network. The connected components greatly vary in size: the largest connected component had 712 members, while the second largest component had 184 members (Mean = 5.37, SD = 32.72). The large number of small connected components indicate there are quite some authors who published either alone, or with few coauthors, in isolation from the rest of the authors.
As indicated in Table 6.2 (Rows indicated by (G-comp)), the giant component only contains 26% of the nodes in the full network, with 29% of the ties. This is a relatively low percentage compared to random networks simulated with similar degree distribution as observed one (i.e. scale-free, preferential attachemnt and random networks). The average degree of the giant component was relatively low (6.24, SD = 6.61), and only slightly higher than the average degree of the full network (5.55, SD = 6.74).
| Metric | Value |
|---|---|
| Number of nodes | 2747 |
| Number of ties | 7618 |
| Mean degree | 5.55 |
| Number of communities | 512 |
| Community size (mean) | 5.37 |
| Community size (SD) | 32.72 |
| Number of nodes (G-comp) | 712 |
| Number of ties (G-comp) | 2221 |
| % nodes in (G-comp) | 25.92 |
| % ties in (G-comp) | 29.15 |
| Number of female authors (G-comp) | 314 |
| Number of male authors (G-comp) | 383 |
| Density (G-comp) | 0.0088 |
| Diameter (G-comp) | 32 |
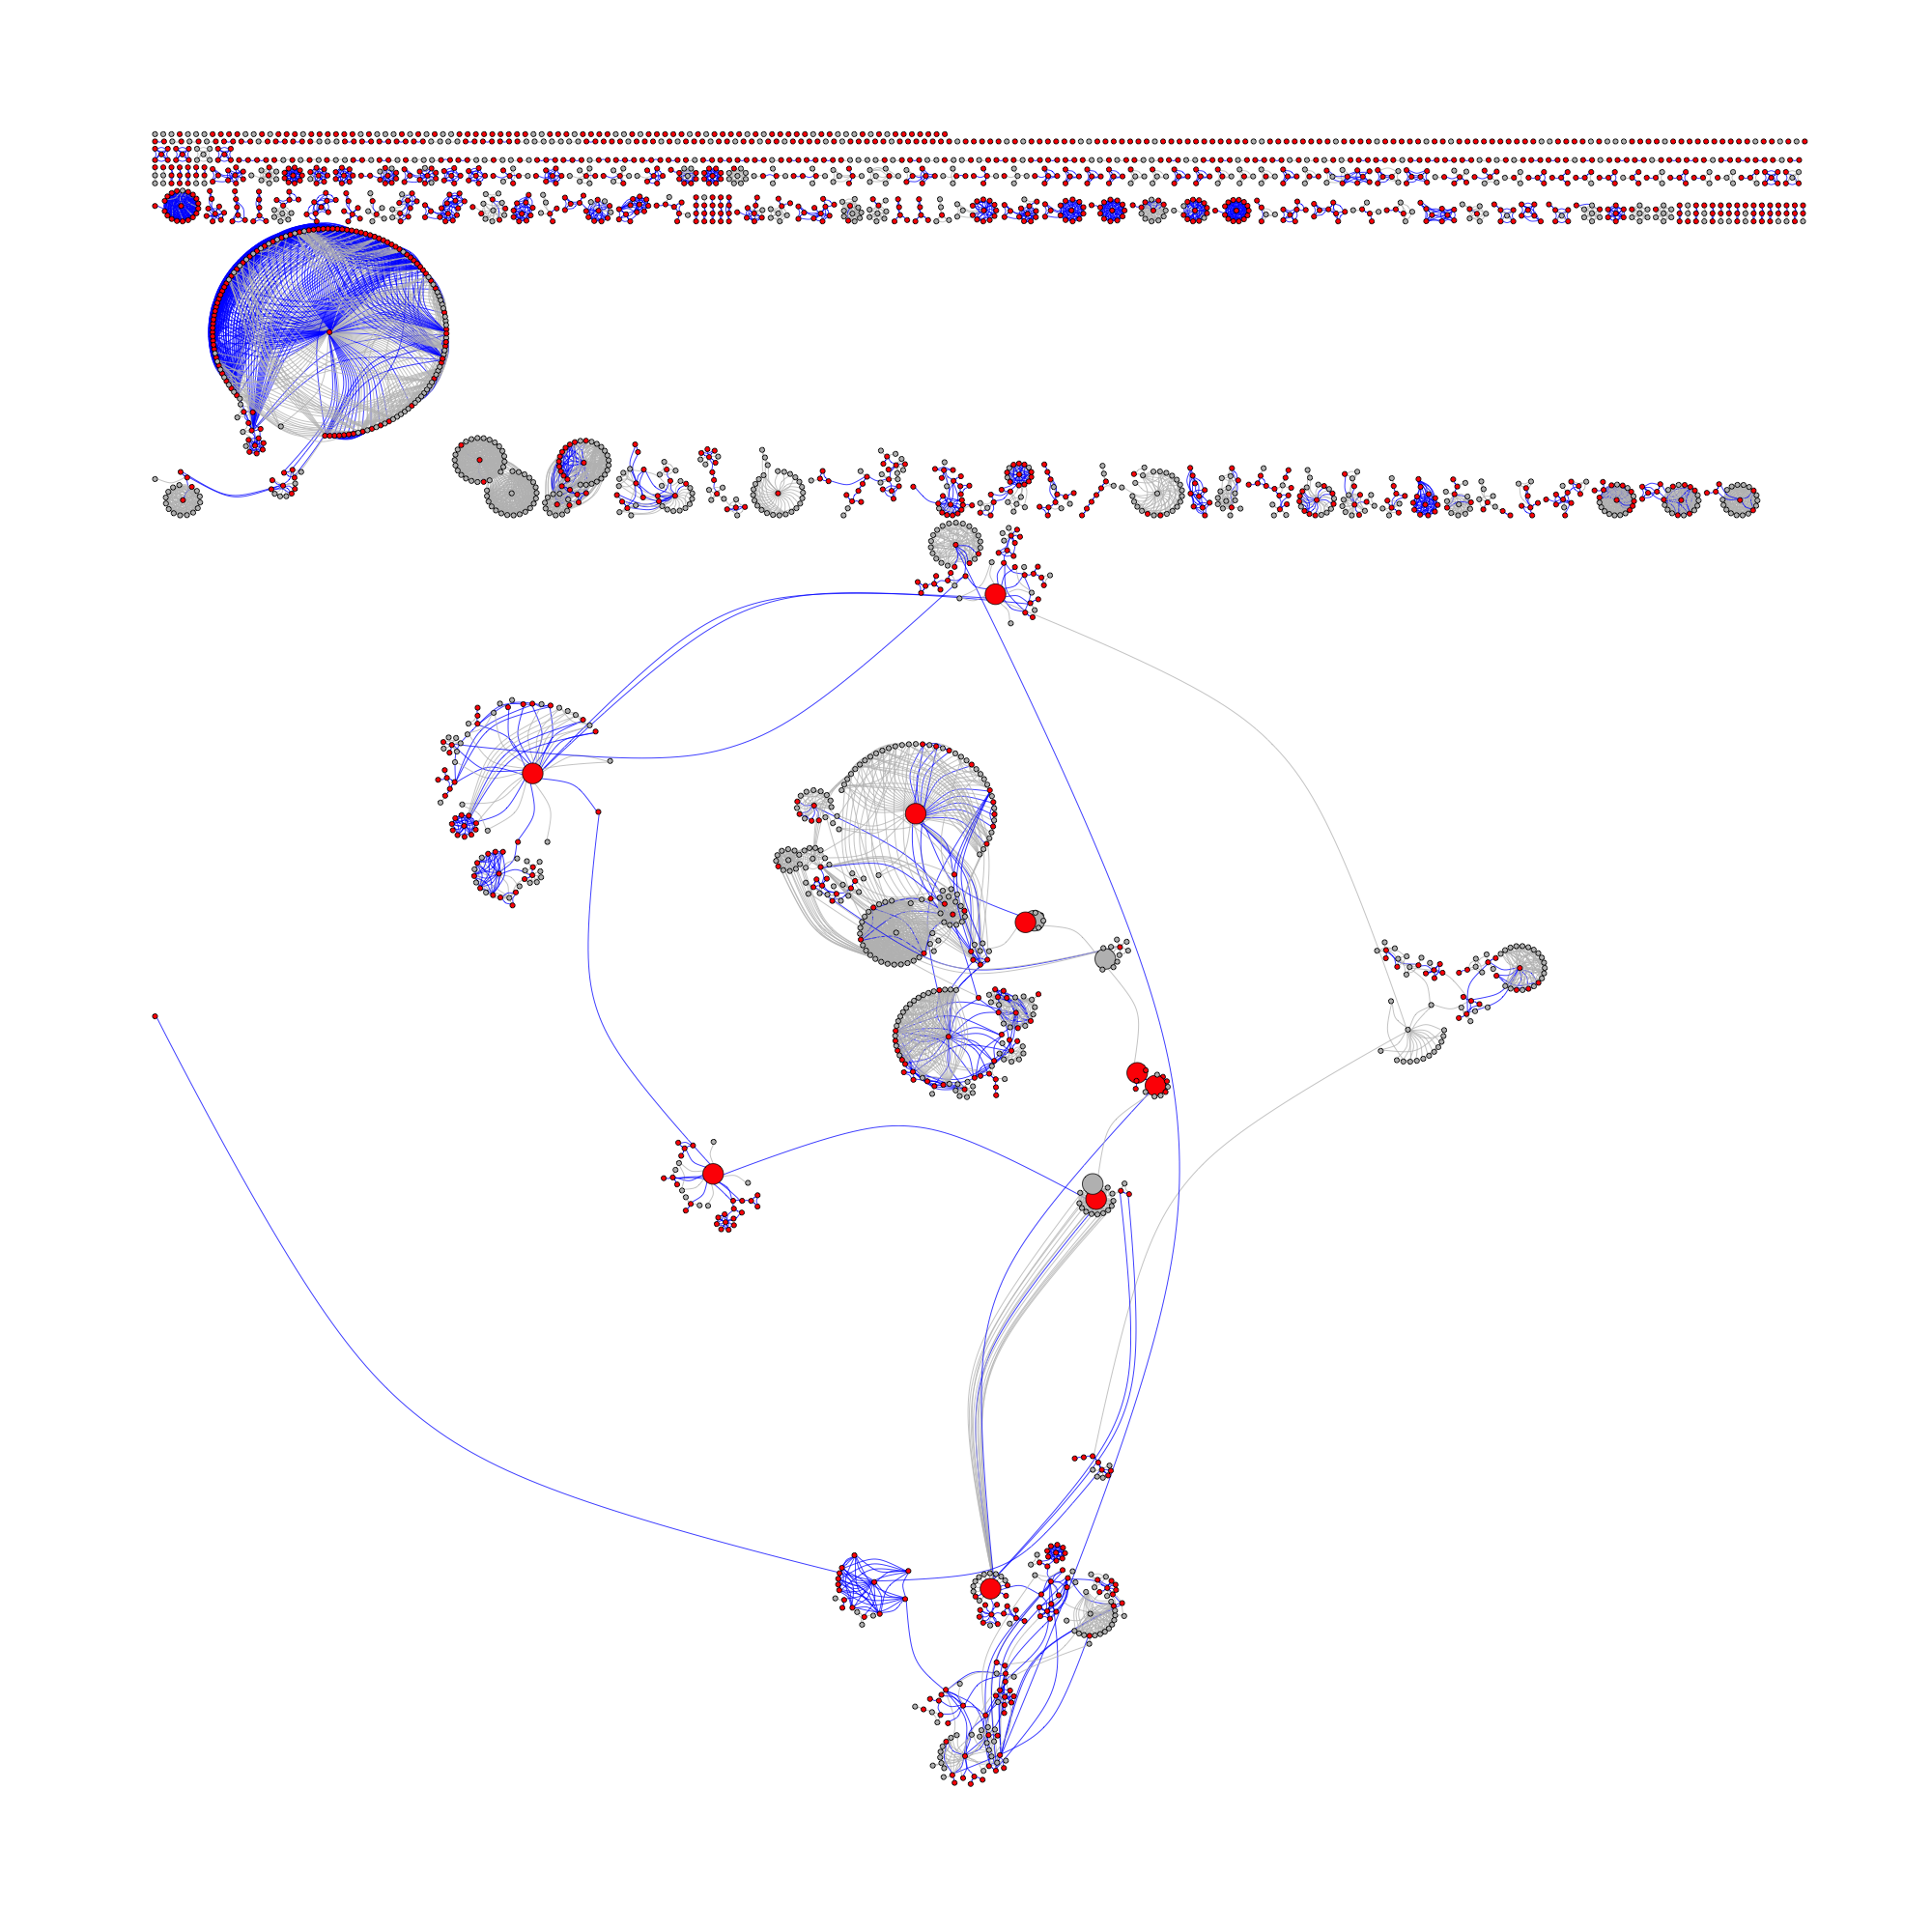
Figure 6.2: The coauthorship network of all Italian sociologists and their coauthors (Colors: Affiliated to Italy = Red, Affiliated elsewhere = Gray, Ties within Italians = Blue, Other ties = Gray, Node size = Betweenness centrality) (Scopus data)
Figure 6.3 provides a different visualization of the coauthorship network and shows the temporal evolution of the authors. Following Palla, Barabási, and Vicsek (2007), who suggested to use this type of visualization to examine the movement of individuals between communities, we distinguished four groups of authors: 1) Those who published at least two years before a given year and continued to publish for at least two years later (old members/staying, see lightest color, bottom stack of bars in plot), 2) Those who published at least two years before a given year with the last publication in the given year (old members/leaving, see darker color than first group, second stack of bars from bottom in plot), 3) Those who first published in the given year, and published for at least two more years (new members/staying, darker than the two first groups, third stack of bars from bottom in plot), and 4) Those who first published in the given year and did not publish from then (new members/leaving, darkest colors, fourth stack of bars on plot).
Note that most authors in the sample were newcomers who immediately left and disappeared from Scopus the following year (darkest stack of bars in Fig 6.3). However, some newcomers joined the core of more senior authors of the sample (second stack of bars from the top).
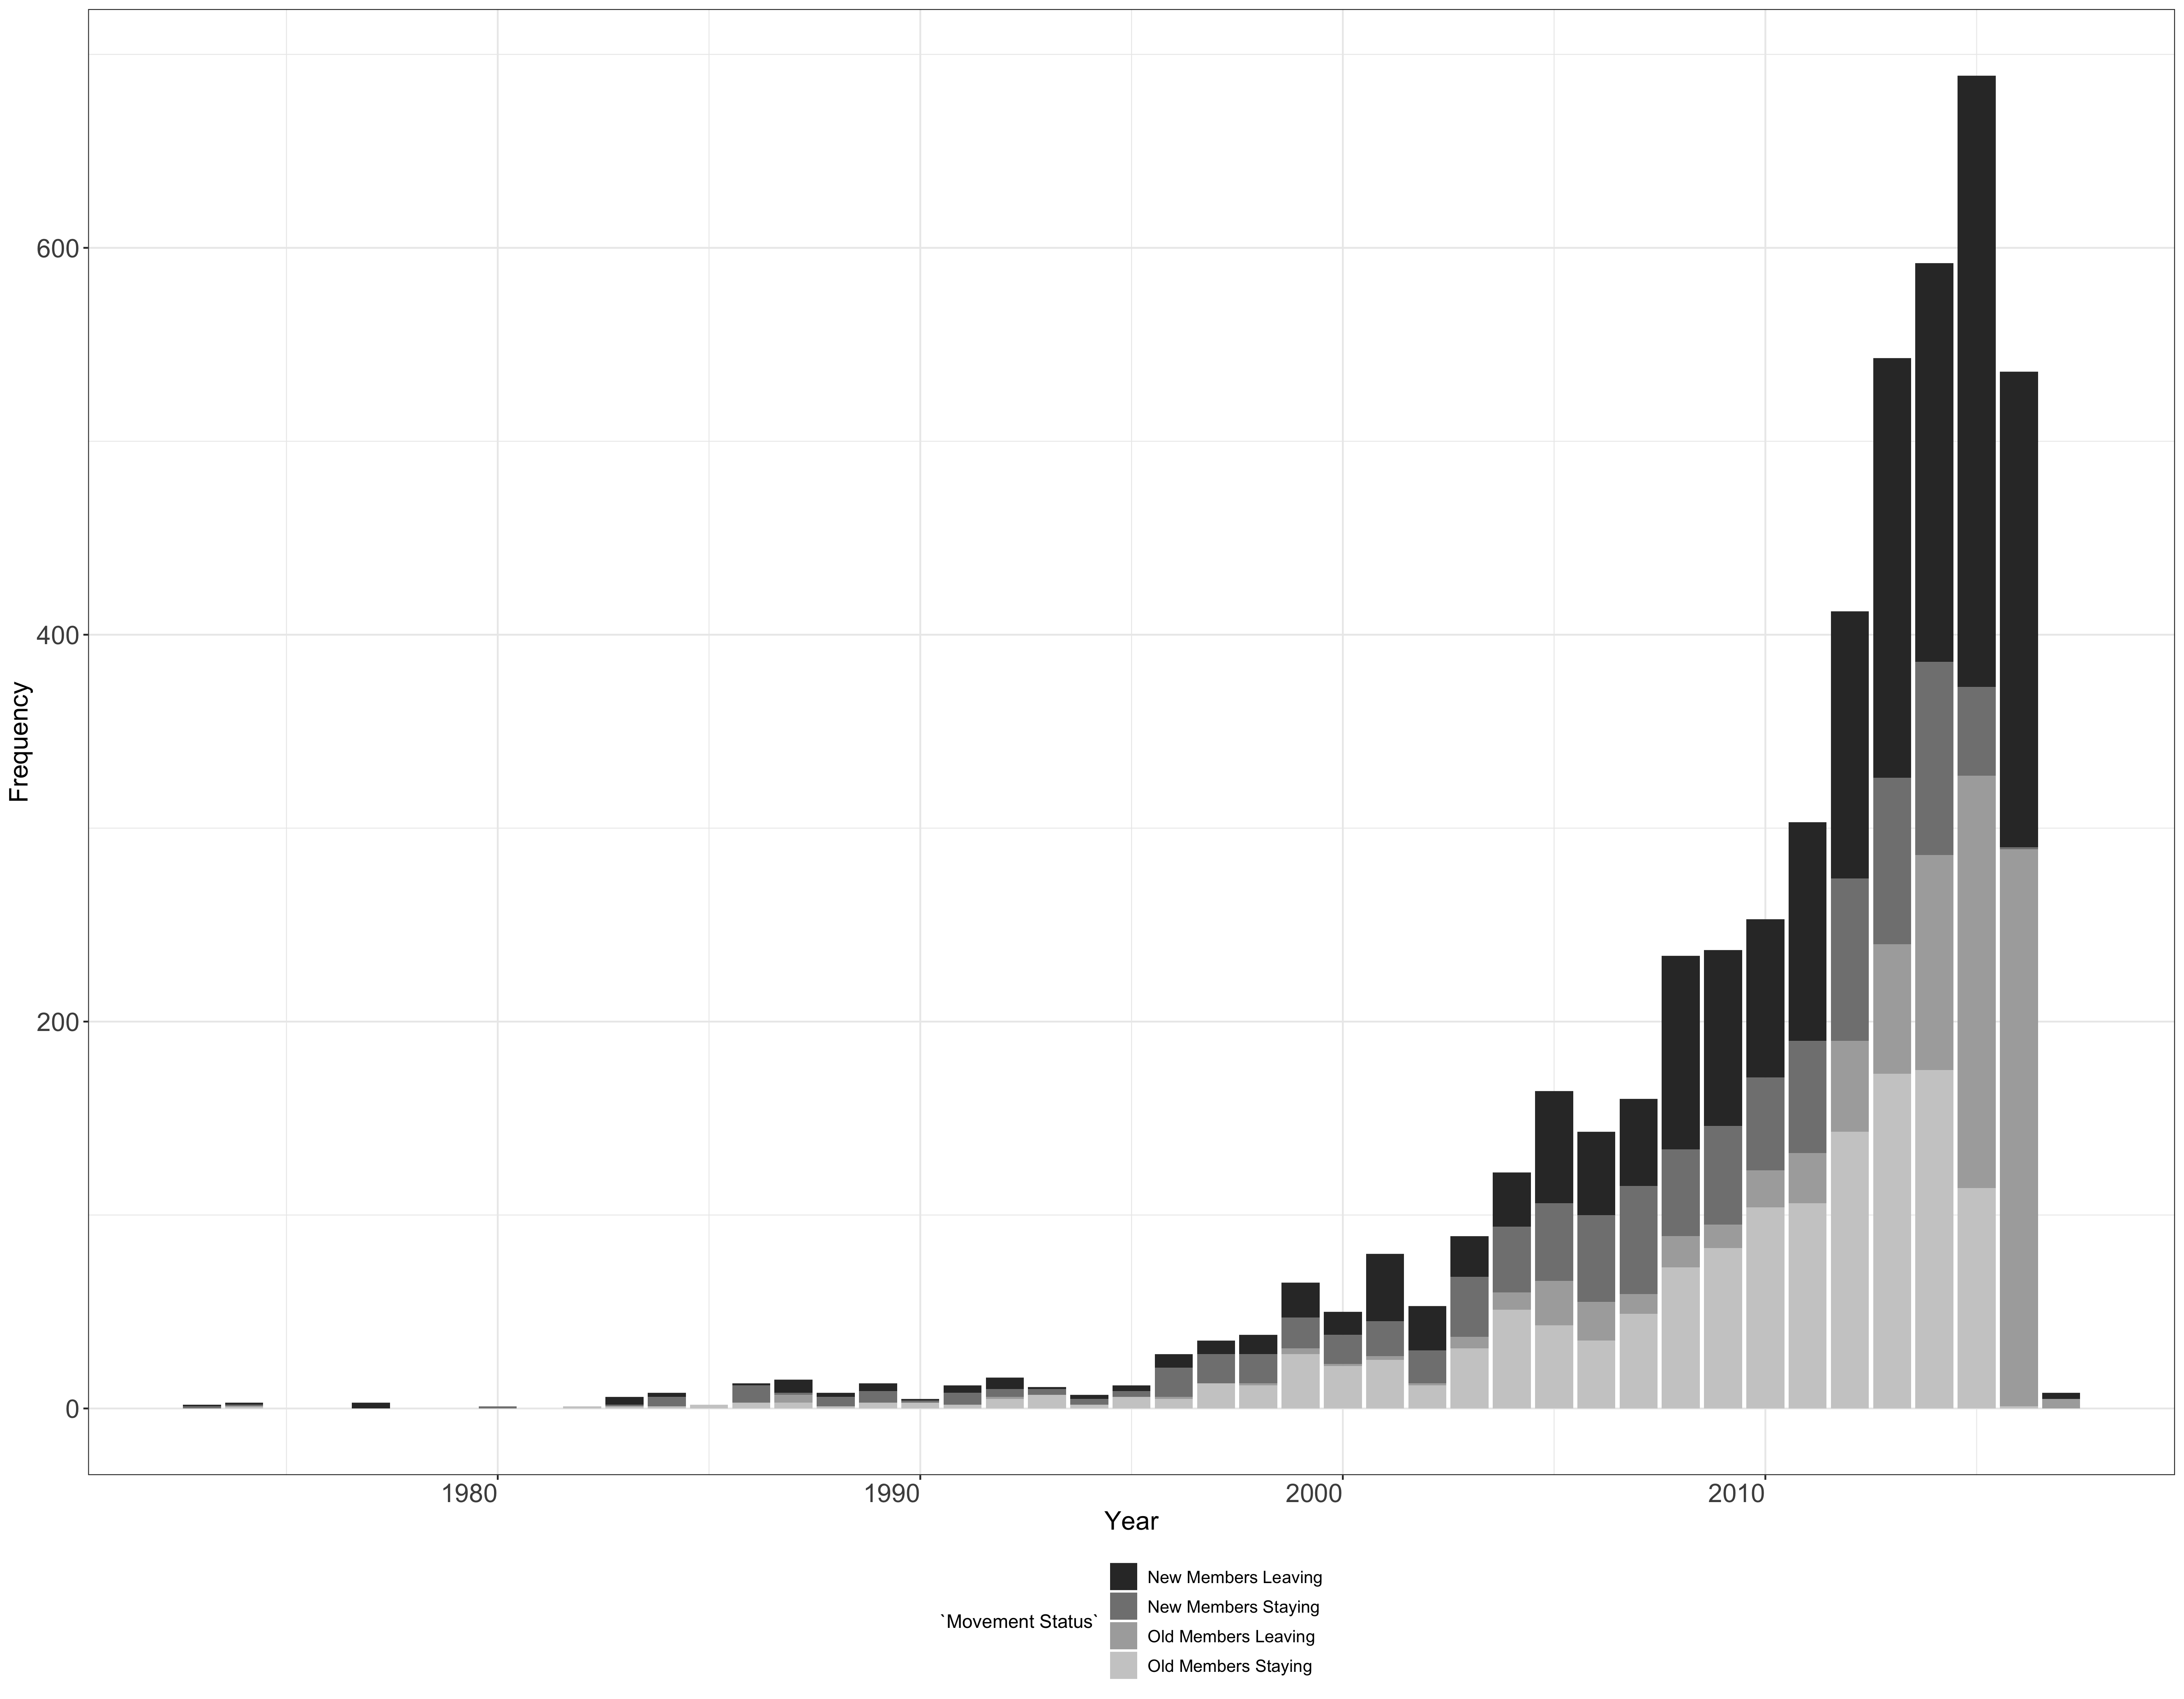
Figure 6.3: The temporal evolution of all authors in sample the x-axis denotes the years, the y-axis denotes the individual authors (Scopus data)
Figure 6.4 shows the two communities detected from the giant component, with a total of 712 authors. We found many isolated authors (244 in the whole network, see Figure 6.2 for a visualization of full graph) or connected components (total of 512) formed between Italian sociologists working with their own group of contacts. Figure 6.4 shows that there was only one tie between the two communities detected in the giant component (in the center of graph, where circles meet squares).
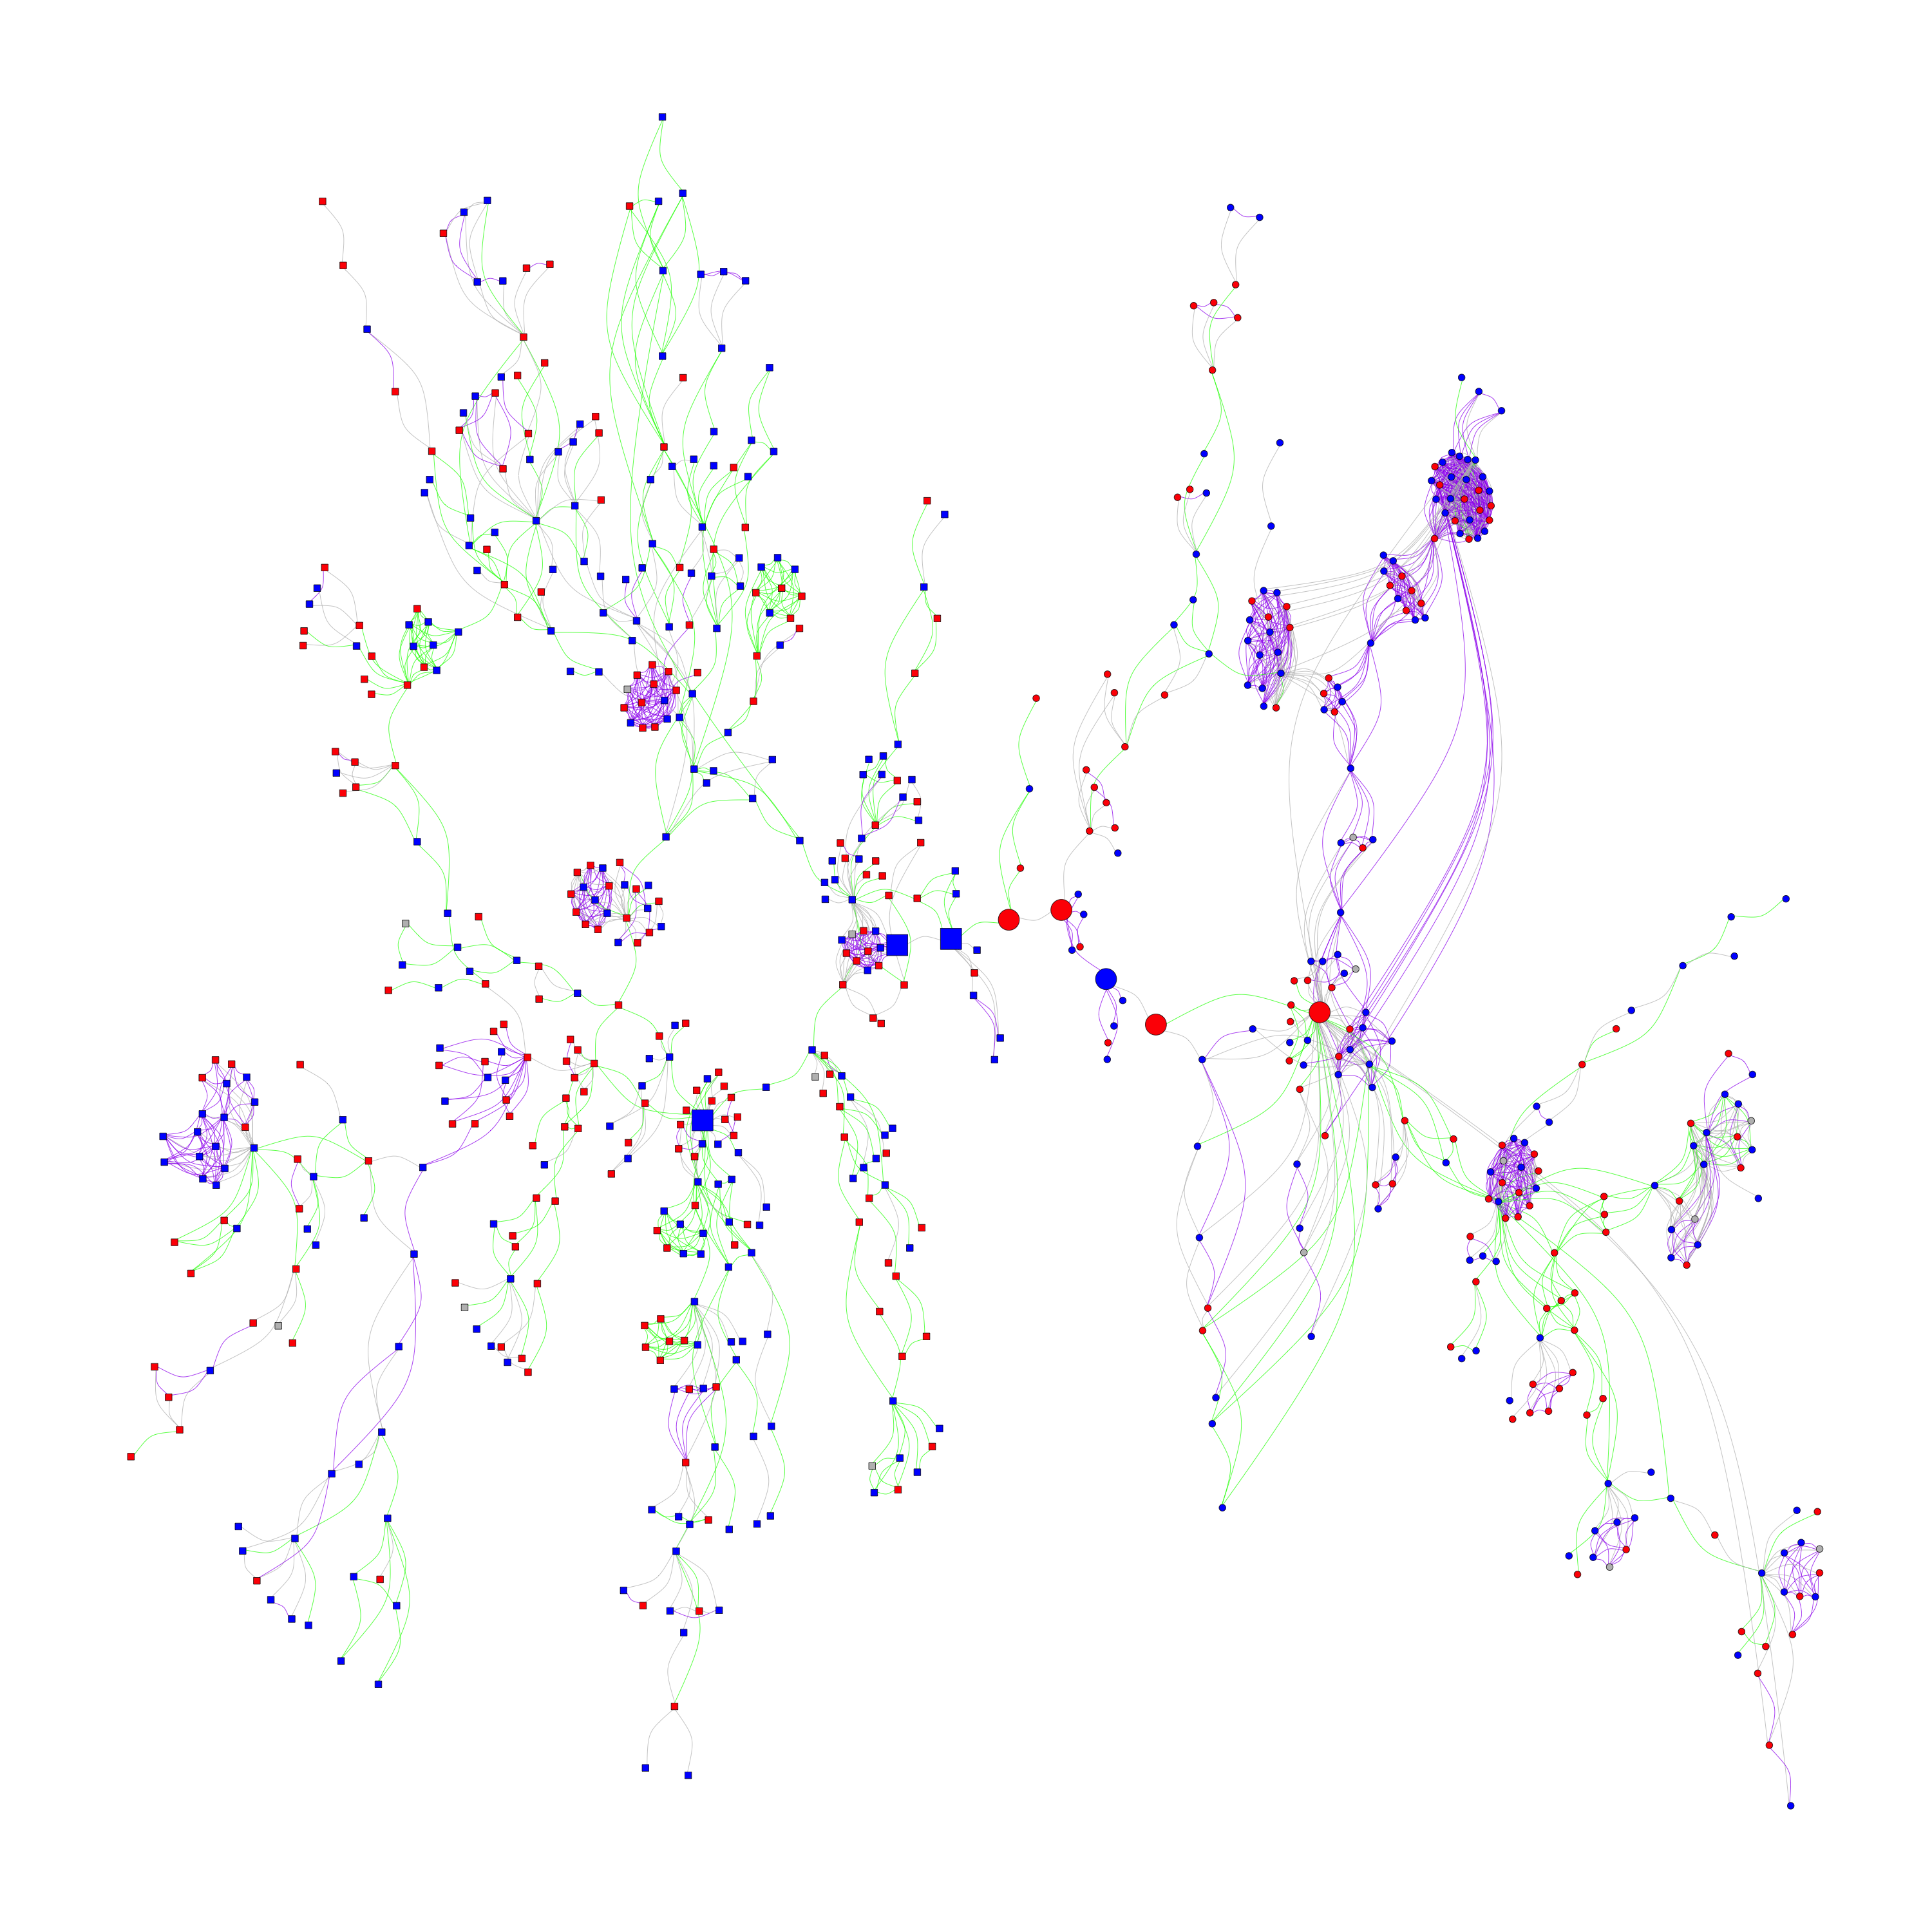
Figure 6.4: The giant component of Italian sociologists and their coauthors network with two communities (Node colors: Males = blue, Females = red, Tie colors: Within Italians = green, Within non-Italians = purple, Between Italians and non-Italians = gray, Node shapes: Square = Community 0 (left side of graph), Circle = Community 1 (right side of graph), Node size = Betweenness centrality) (Scopus data)
Figure 6.5 shows the temporal evolution of the members of the two communities detected in the giant component. Unlike the case of the whole network, in which there was systematic turnover of newcomers (see height of darkest color stacked bars relative to height of lightest color bars on Figure 6.3), these two communities have a much more stable core (see height of the bar of the lightest color compared to the height of the bar of the darkest color), which does not change while including new members (see third stack of bars on plot). Certain members of the giant component disappeared from the sample because there were no other publications of them indexed in Scopus (see fourth stack of bars, newcomers who left and old members who left, second stack of bars on plot from bottom).
Figure 6.5: The temporal evolution of communities of the giant component. The x-axis denotes the years, the y-axis denotes the count of individual authors (Scopus data)
Figure 6.6 shows that community 0 (darker color on top part of plot on the left) is the bigger community of the giant component with 454 members, while community 1 (lighter color on the bottom of plot on the left) is the second community in size, including 258 members. The right panel of Figure 6.6 shows the gender distribution in these two detected communities (see details on overall percentages below in Table 6.3). This Figure presents further detail on the temporal activity of authors within each of the communities detected from the giant component and should be compared to Figure 6.5. Consider the share of newcomers who leave in each year, i.e., those on the stack of bars without a ribbon connecting to them from previous years and without a ribbon going out of them to next years, which are ordered and positioned on the top parts of the bars within each community. The majority of people in a community in 2015 and later years are leaving newcomers. In both communities the share of male authors was higher among the staying members , whereas females were more present among the newcomers leaving (For a gender based comparison, see the ribbons connecting authors in each group of stacked bars on right panel of Figure 6.6 or Figure 6.11 in the Appendix section).
Figure 6.6: Communities 0 and 1 found with Temporal Community detection (left) and gender composition (right) the x-axis denotes the years, the y-axis denotes the individual authors, each author is connected to him/herself with a ribbon over the years) (Scopus data)
Table 6.3 shows the share of these two communities considering author attributes (i.e. gender and country of affiliation). It is worth noting that we did not find any significant gender differences in the two communities, at least in terms of overall share of members (see the plot on the right panel of Figure 6.6). However, as described above, we found gender differences in the share of newcomers leaving and old members staying (For a gender based comparison, see Figure 6.11 in the Appendix). Regarding the country of affiliation, we found that community 0 was composed of sociologists working in Italy while community 1 had a higher share of international authors, from either Europe or other countries.
| Community | Female | Male | Missing gender | Europe | Italy | Other | Missing country |
|---|---|---|---|---|---|---|---|
| 0 | 45% | 54% | 2% | 37% | 53% | 6% | 5% |
| 1 | 43% | 54% | 3% | 53% | 30% | 11% | 5% |
Table 6.4 shows the percentage of ties within and between the two communities. We found the lowest possible ties among the two communities (0.05% equal to one tie out of 2,221 total) and the highest ties within each community. To understand the possible underlying mechanisms of community membership in more detail, we considered other author attributes.
Table 6.5 shows the percentage of ties within and between authors of different gender. The highest percentage of ties between authors of the giant component (43.18%) were cross-gender collaborations, while 33.72% of all ties formed in the giant component were within male authors. In line with previous findings, female-to-female coauthorship ties were rarer (e.g., Teele and Thelen (2017)). However, it is worth noting that the total number of females (44.1%) were lower than male authors (53.79%). This means that these findings could be due to the lower number of potential female collaborators to choose among.
Table 6.6 shows the percentage of ties within and between two specific groups of authors: 1) Those who were currently hired Italian sociologists and 2) those who could be affiliated either in an Italian institution or abroad, either sociologist or not, either active or retired, but in any case, not included in the administrative list. Note that the highest percentage of ties (46.2%) were within those not currently employed in an Italian institution. Only 25.35% of ties were within Italian sociologists.
| Within community 0 | Within community 1 | Between communities 0 and 1 |
|---|---|---|
| 46.15 | 53.8 | 0.05 |
| Within males | Within females | Between males and females |
|---|---|---|
| 33.72 | 18.87 | 43.18 |
| Within Italians | Within non-Italians | Between Italians and non-Italians |
|---|---|---|
| 25.35 | 28.46 | 46.2 |
Table 6.7 shows the most popular and prolific authors in the giant component and their gender. Confirming previous findings (Abramo, D’Angelo, and Caprasecca 2009b; Cole and Zuckerman 1984; Leahey 2006), male authors dominate the picture, being the most prolific and having the highest betweenness, triangle counts and degree.
| Betweenness | Most Prolific | Triangles | Degree |
|---|---|---|---|
| Bosi (Male) | Fortunati (Female) | D’Ambrosi (Female) | Fortunati (Female) |
| Mattoni (Female) | Pavolini (Male) | Splendore (Male) | Neresini (Male) |
| Della Porta (Female) | Diani (Male) | Harro-Loit (Female) | D’Ambrosi (Female) |
| Pavolini (Male) | Boccagni (Male) | Eberwein (Male) | Splendore (Male) |
| Treré (Male) | Bucchi (Male) | Groenhart (Male) | Harro-Loit (Female) |
| Farinosi (Female) | Brighenti (Male) | Porlezza (Male) | Diani (Male) |
| Boccagni (Male) | Ambrosini (Male) | Fengler (Female) | Eberwein (Male) |
| Giugni (Male) | Ballarino (Male) | Alsius (Male) | Groenhart (Male) |
| Pilati (Female) | Ruzza (Male) | Baisnée (Male) | Porlezza (Male) |
| Diani (Male) | Mazzoleni (Male) | Bichler (Male) | Pavolini (Male) |
6.3.1 Substantive focus of research
In order to understand the border between the two communities of the giant component better, we considered the type of research. We developed term maps based on titles, keywords and abstracts of all papers included in the sample. By overlaying the community membership (i.e. communities 0 and 1 of the giant component) on top of the substantive term maps, we tested the hypothesis that membership in communities was based on similarity in research focus between members.
As shown in Figures 6.7, 6.8 and 6.9 (see the focus of research of each group on the yellow part of the term map), community 0 mainly consisted of economic sociologists doing research, for instance, on labour market, employment, migration, and inequality, while community 1 mainly consisted of political sociologists studying public opinion, Internet, news, journalist, and elections, to name a few topics. Figure 6.9 shows the substantive focus of all other authors who were not a member of the giant component. While their focus was clearly different from communities 0 and 1, they obviously do not overlap because they focus on different topics.
Figure 6.7: The substantive focus of members of community 0 of coauthorship network overlaid on terms extracted from all publications visualized with VOS viewer (Yellow parts on plot show the highest substantive focus e.g., higher frequency of those terms in the corpus)
Figure 6.8: The substantive focus of members of community 1 of coauthorship network overlaid on terms extracted from all publications visualized with VOS viewer (Yellow parts on plot show the highest substantive focus e.g., higher frequency of those terms in the corpus)
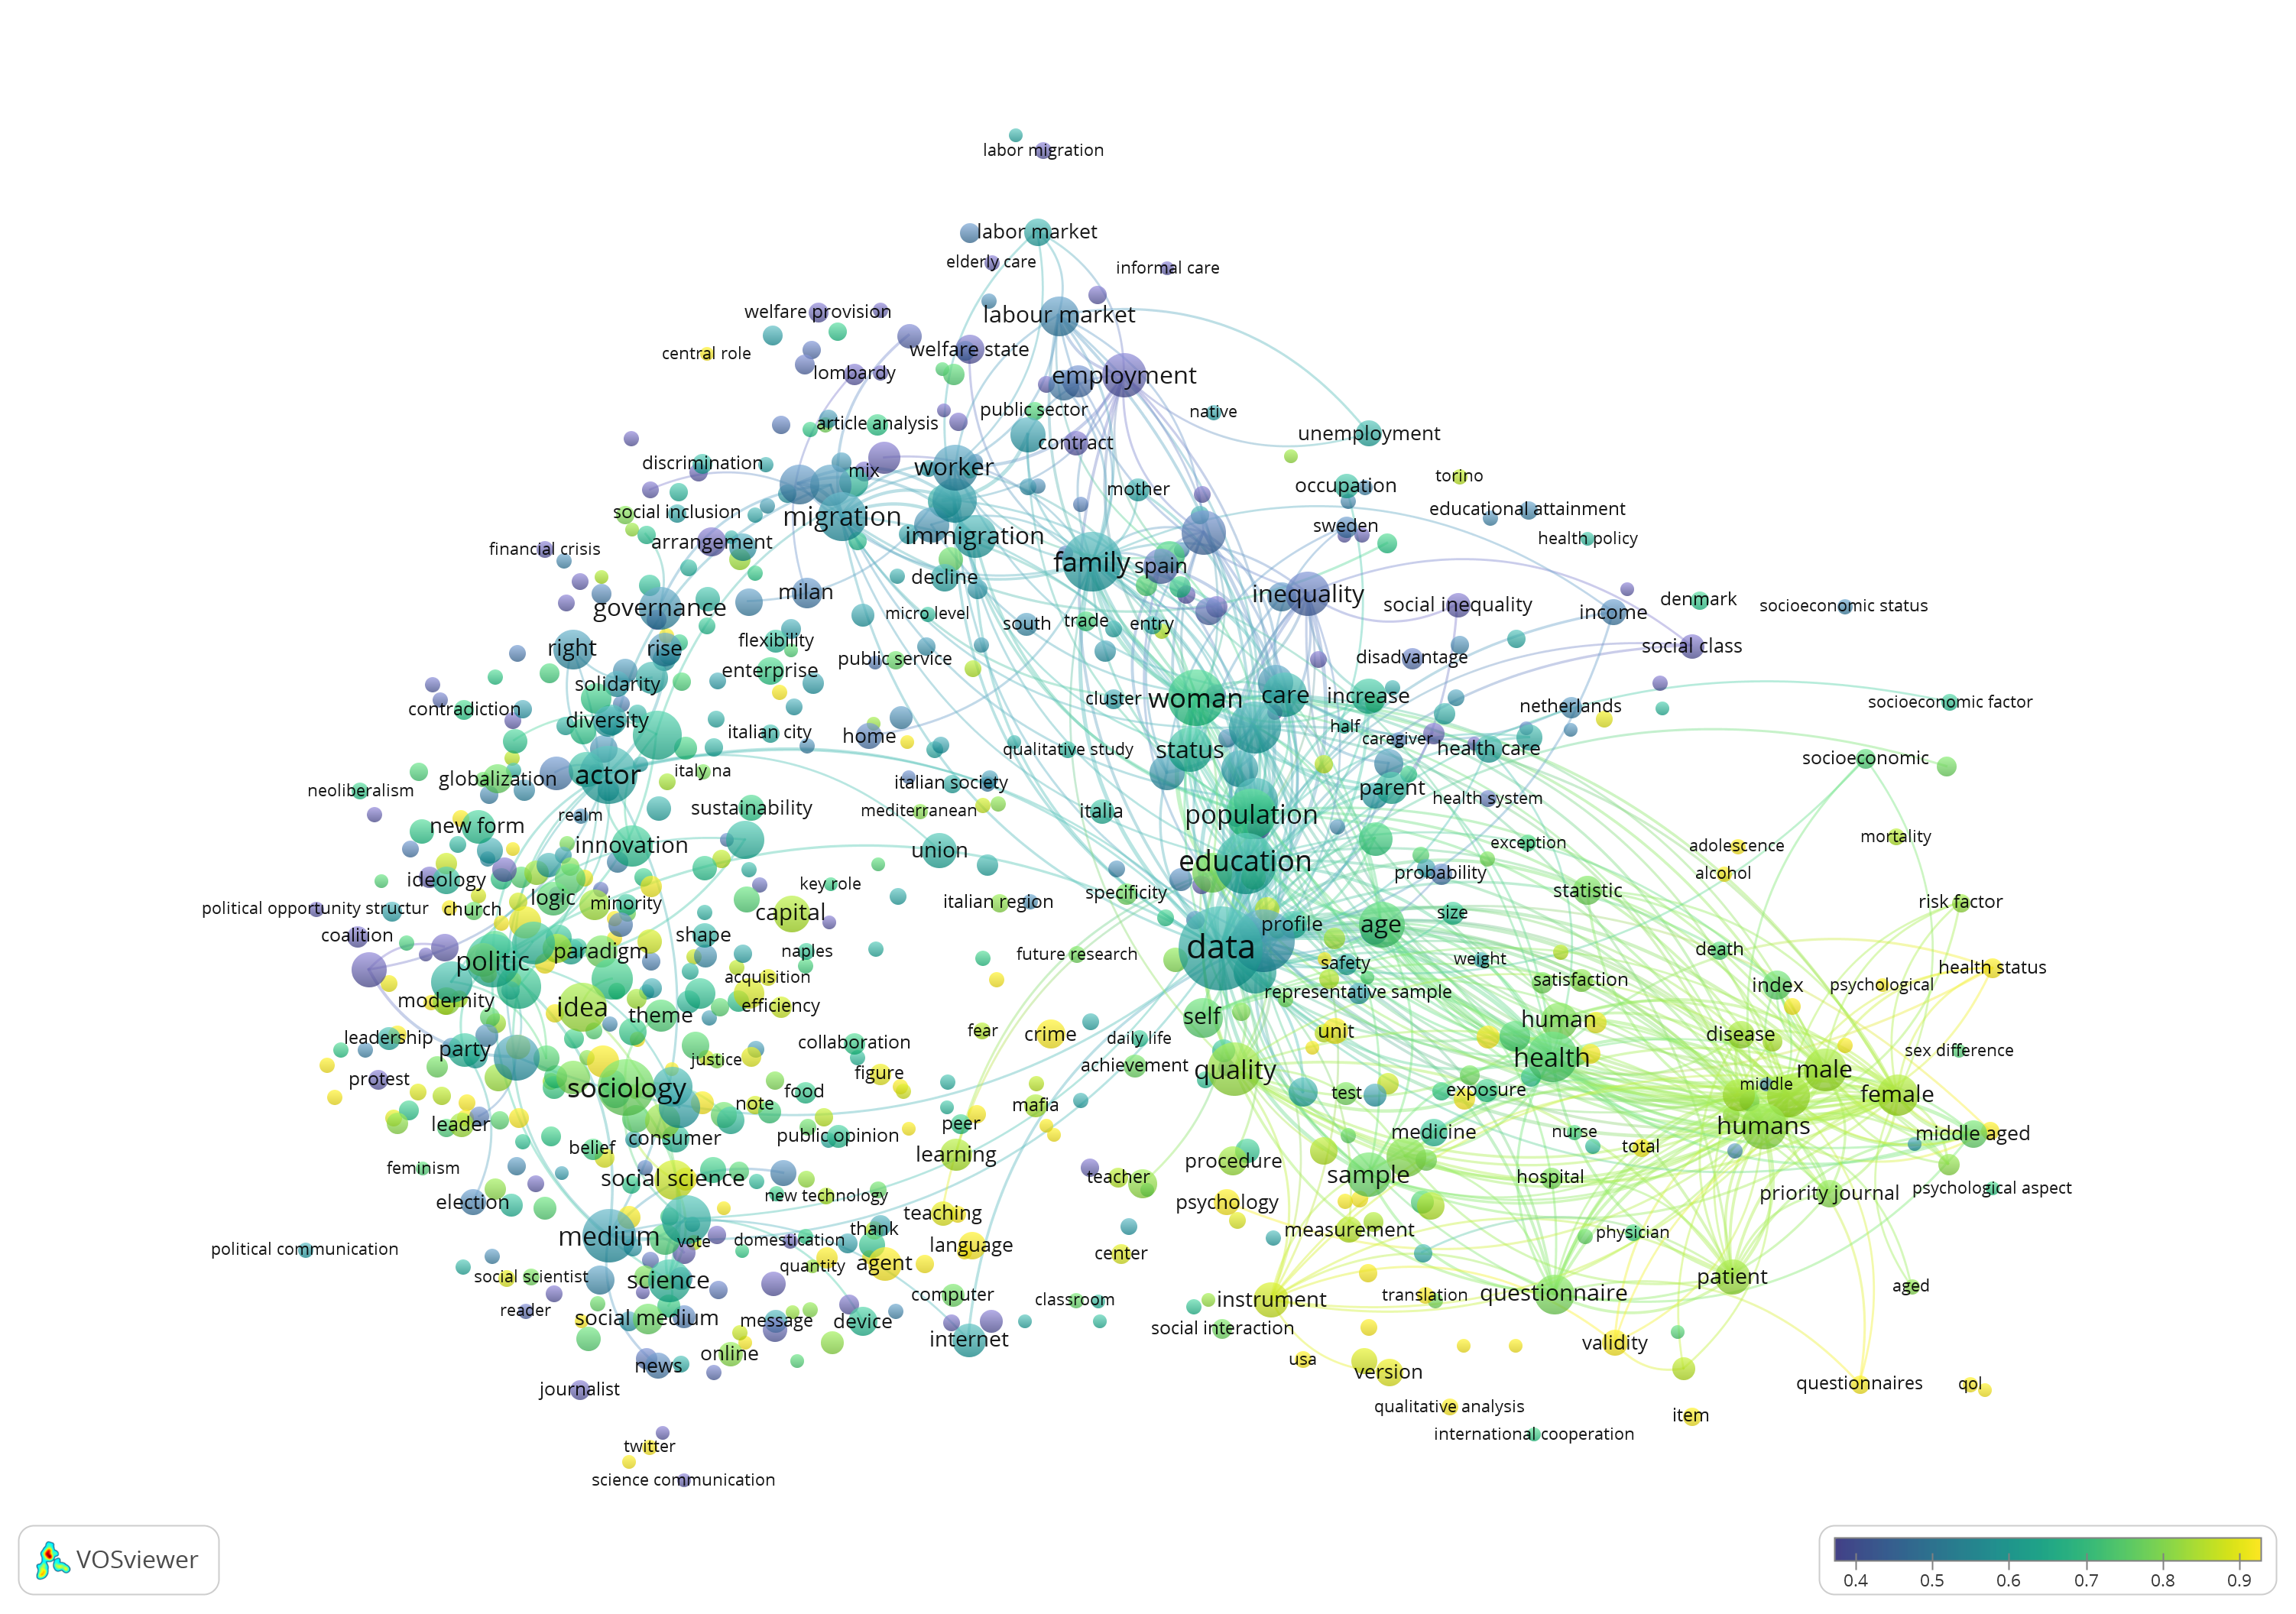
Figure 6.9: The substantive focus of those not member of the giant component of coauthorship network overlaid on terms extracted from all publications visualized with VOS viewer (Yellow parts on plot show the highest substantive focus e.g., higher frequency of those terms in the corpus)
In order to examine mechanisms that can explain these patterns, we built four ERGMs, including structural and individual factors. Table ?? shows results of the four ERGMs. Model 1 included only structural effects (i.e. ties and preferential attachment). It shows that there was a strong effect of preferential attachment in coauthorship ties existence. This indicates that authors who were already famous scholars with higher number of collaborations were the ones with higher probability of forming coauthorship ties.
Note, given that the coauthorship network is a one-mode projection of bipartite ties, i.e. paper-author ties, higher rates of cliquish structures can be simply due to articles with high number of authors, as this typically generates a maximal clique. This can determine a high preferential attachment effect. To control for this, we included temporal community detection membership by considering cross-sectional networks of coauthorship yearly. This is expected to reduce the artificial importance of cliquish structures because the communities are detected over all years not a single year. Consider that unlike in the hard sciences, multiple coauthorship ties in the same year are rare among sociologists. Note also that this yearly view on the whole network helped us to reduce the effect caused by bipartite to one-mode projection.
Furthermore, we added other author attributes to see if the preferential attachment effect will hold. Model 2 included only author attributes (e.g., gender, continental region of affiliation, similarity in first and last publication dates which would indicate seniority and experience and the total number of publications). ERGMs model the probabilty of tie existence, since our community detection configuration is rewarding ties within a community than between two communities, therefore naturally membership in those communities would have an endogeneity effect leading to high effect of community membership on tie existense in ERGM. Thus, in Model 2 we have excluded temporal community membership which is added in Model 3. The main effects between the two models stayed the same with Model 3 having better BIC and AIC. We found that being member of one of the two temporal communities (i.e., having substantive research focus similar to economic or political sociologists) had the highest effect in increasing the tie existence probability. Tie existence was also influenced in descendent order of probability by working in other countries (e.g., North America, Australia and New Zealand, South America and Asia), European countries, institutions in Italy, having close or similar date of latest publication (e.g., publishing until recently)30 , being male, having close or similar date of earliest publication or having different number of total publications31. Being female did not have any significant effect on tie existence.
Finally, Model 4 shows the mix of effects in Models 1, 2 and 3. We found that including author attributes and temporal community detection significantly decreased the structural effect of preferential attachment on tie existence (from a coefficient equal to 15.095 in Model 1 down to 4.063 in Model 332). Effect of other variables had the same order and quite similar rates as in Model 2 and 3.
To sum up, the results show that having a similar substantive research focus and working in specific countries had an effect on the way Italian sociologists collaborated and their international exposure. Secondly, we found that the general rule of the “rich gets richer” was highly affected by the interplay between these variables. Note that the mixture of node attributes and community level effects model specification in Model 4 was a better fit than Models 1, 2 and 3 (see AIC and BIC measures in the last rows of the table, the smaller, the better).
| The Giant component of Italian sociologists and their coauthors | ||||
| ERGM Models | ||||
| (1) | (2) | (3) | (4) | |
| Ties | -4.549*** (0.022) | -4.354*** (0.050) | -11.348*** (0.997) | -11.254*** (1.012) |
| Preferential attachment | 15.095*** (4.421) | 4.063*** (0.976) | ||
| Homophily Females | 0.002 (0.059) | 0.049 (0.060) | 0.067 (0.060) | |
| Homophily Males | 0.281*** (0.049) | 0.267*** (0.049) | 0.258*** (0.054) | |
| Community 0 | 7.207*** (0.996) | 7.136*** (1.015) | ||
| Community 1 | 8.318*** (0.996) | 8.216*** (1.015) | ||
| Europe | 1.226*** (0.051) | 1.099*** (0.053) | 1.113*** (0.059) | |
| Italy | 0.600*** (0.057) | 0.718*** (0.059) | 0.716*** (0.067) | |
| Other countries | 1.546*** (0.170) | 1.188*** (0.177) | 1.170*** (0.216) | |
| Homophily Total Pubs | 0.060*** (0.002) | 0.063*** (0.002) | 0.063*** (0.003) | |
| Homophily First Pub | -0.092*** (0.006) | -0.095*** (0.006) | -0.095*** (0.007) | |
| Homophily Last Pub | -0.372*** (0.014) | -0.367*** (0.014) | -0.369*** (0.016) | |
| Akaike Inf. Crit. | 25,237.220 | 22,732.670 | 19,277.840 | 19,154.370 |
| Bayesian Inf. Crit. | 25,268.540 | 22,826.640 | 19,392.700 | 19,290.110 |
| Note: | p<0.1; p<0.05; p<0.01 | |||
6.4 Conclusions and discussion
Our study provided an empirical overview of collaboration within and between sociologists in Italy and their collaborators worldwide. We constructed a coauthorship network based on the publications indexed in Scopus and used temporal community detection to detect the two largest and most stable communities of the giant component. Although the communities are gender balanced, male newcomers are more likely to continue in academia than females. The communities differ in their research focus and international exposure. We ran ERGMs to control the effect of certain author attributes (i.e. gender, country of affiliation and scientific career), local structural configurations and community memberships (i.e. substantive focus) on coauthorship tie.
In general, we found that Italian sociology is a collection of isolated islands. The coauthorship pattern was mainly driven by preferential attachment and research focus. When we considered other author attributes, the preferential attachment effect was reduced. Our findings showed that adopting a multi-level approach while considering temporal dimensions in the study of scientific collaboration is key to reveal the interplay between factors of different levels (e.g., individual, community, covariate attributes and network structure levels).
Our results revealed two communities of sociologists that are relatively well connected among each other. First, we found a community of economic sociologists studying labour market, employment, migration, and inequality. The second community included political sociologists studying public opinion, Internet, news, journalist, and elections. These two communities form the giant component of the coauthorship network of sociologists in Italy. We also found many (511) other connected components of authors publishing either alone or with few authors (Babchuk, Keith, and Peters 1999). The community of political sociologists is more international than the community of economic sociologists. Both communities have been growing in size in recent years. It seems our results are more in line with first hypothesis of Moody (2004)’s study (a small world of distant communities) since we found many distant communities and in case of the two main communities in the giant component they had specific research focuses with lowest possible ties with the other community.
Whether these communities are influenced by the scientific disciplinary sectors or by the specific department environments in which scientists are embedded could be subject of further inquiry.
This would also require a more extensive sample coverage. Indeed, despite the fact that Scopus has the highest coverage among bibliographic data sources (especially in Italian language as shown in Mongeon and Paul-Hus (2016)), Italian sociologists publish many articles, book chapters and monographs that are not indexed in Scopus. Previous research showed that only 63.81% of Italian sociologists have at least one publication record indexed in Scopus and it could be due to lower coverage of Italian language or local publication outlets (Akbaritabar, Casnici, and Squazzoni 2018). This could have limited the completeness of the coauthorship networks. Further research using sources such as Google Scholar, which covers more Italian publishers, could help to complete this type of analysis.
Secondly, our analysis did not provide a robust explanation of the underlying mechanisms that account for these observed patterns. For instance, strategic decisions about collaboration could be constrained by certain factors, such as joint collaboration in research proposals, PhD programs, and scientific associations or academic mobility across institutions, which we did not consider here. Furthermore, collaboration could be inhibited by the institutional separation between different disciplines in Italy, which have a strong influence on grants, hiring and promotions. Finally, coauthorship patterns could also reflect the capacity of certain scientists to build international ties. Not only do international collaborations increase recognition and prestige of the most productive scientists; they in turn tend to stimulate network expansion leading to self-reinforcing processes (Leydesdorff, Park, and Wagner 2014).
6.5 Appendix
Figure 6.10 presents the goodness of fit analysis for our ERGM model (It is only shown for the most extended one, Model 4 in Table ??). It considers the model specification and estimates to what extent our model was able to detect the observed network’s behavior. Considering that in order to control for preferential attachment our attention was on the degree distribution, the first panel in top left side of Figure 6.10 indicates that our model predicted considerably well our observed network. However, it must be said that in other goodness of fit measures, which are based on edgewise shared partners (that we didn’t include in the model do to degeneracy issue) on top right, and the minimum geodesic distance (on which normally most ERGMs are not good) left bottom, our model did relatively bad. On the Goodness of fit evaluation based on covarriates (bottom right of Figure 6.10) our model did well.
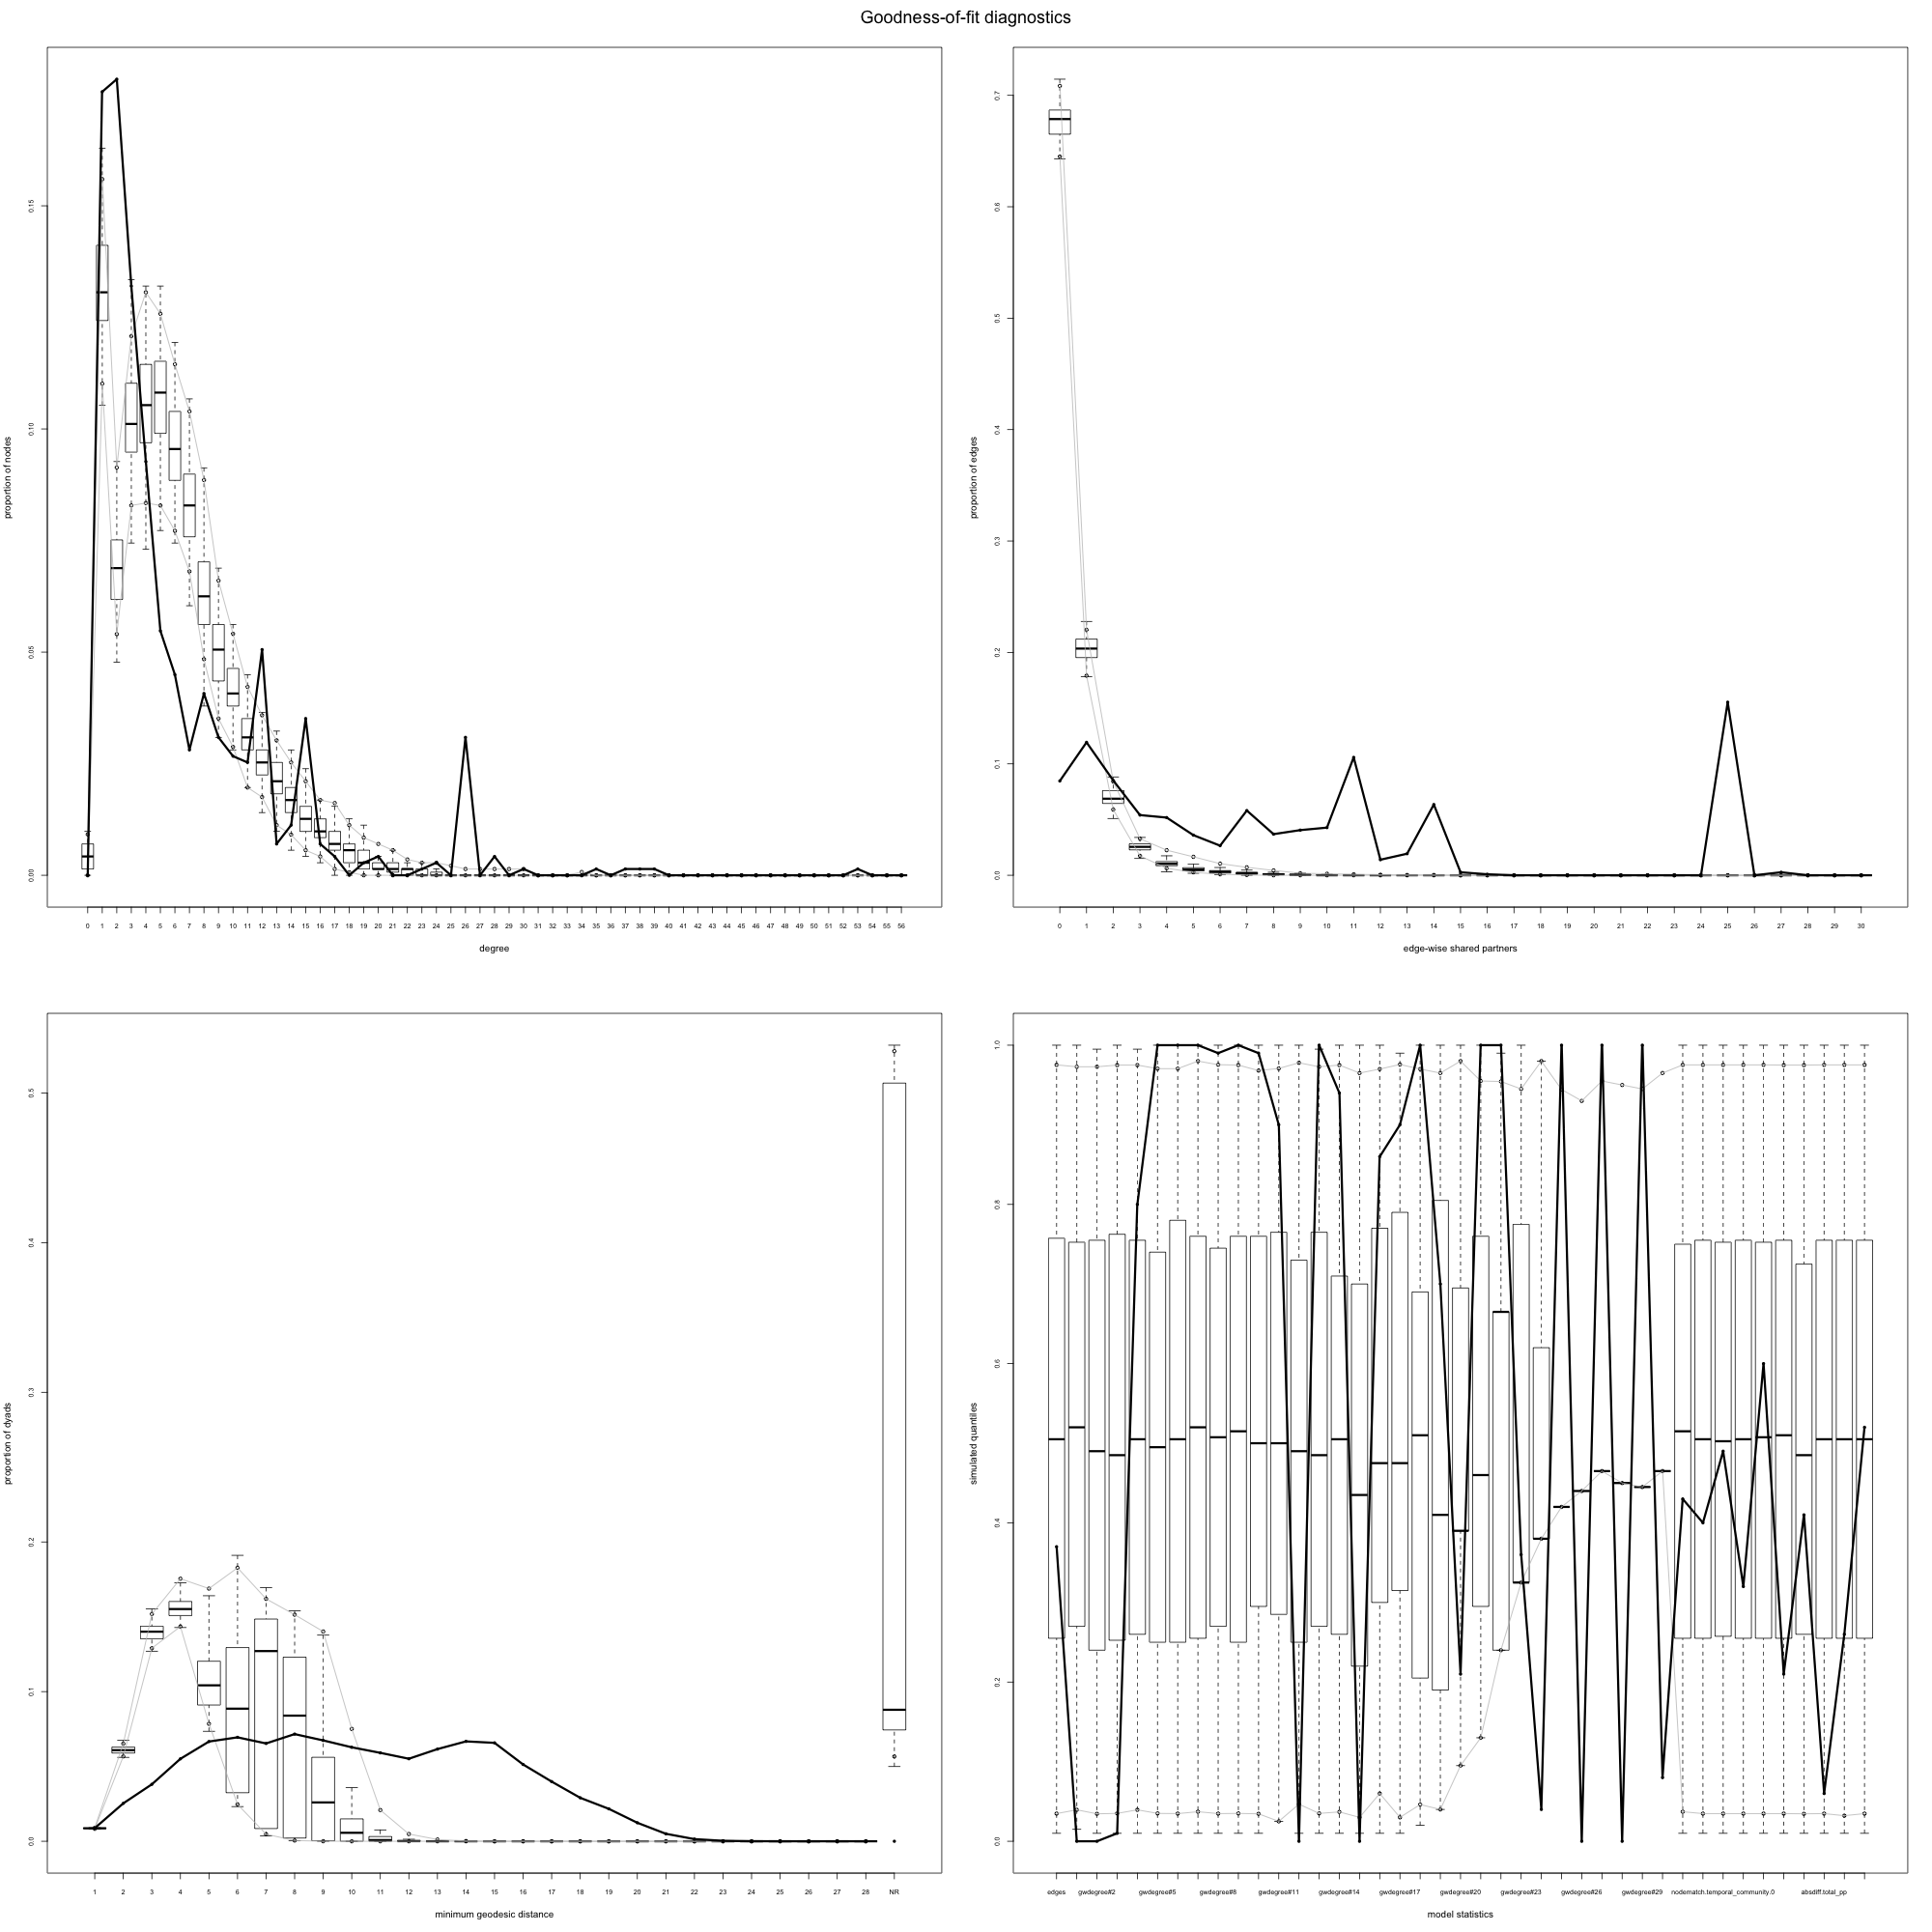
Figure 6.10: Goodness of fit analysis of ERGM results (black solid line represents the observed network)
Figure 6.11 presents an elaborated version of Figure 6.5 and adds details on the temporal movement differences of gender in the communities detected in the giant component.
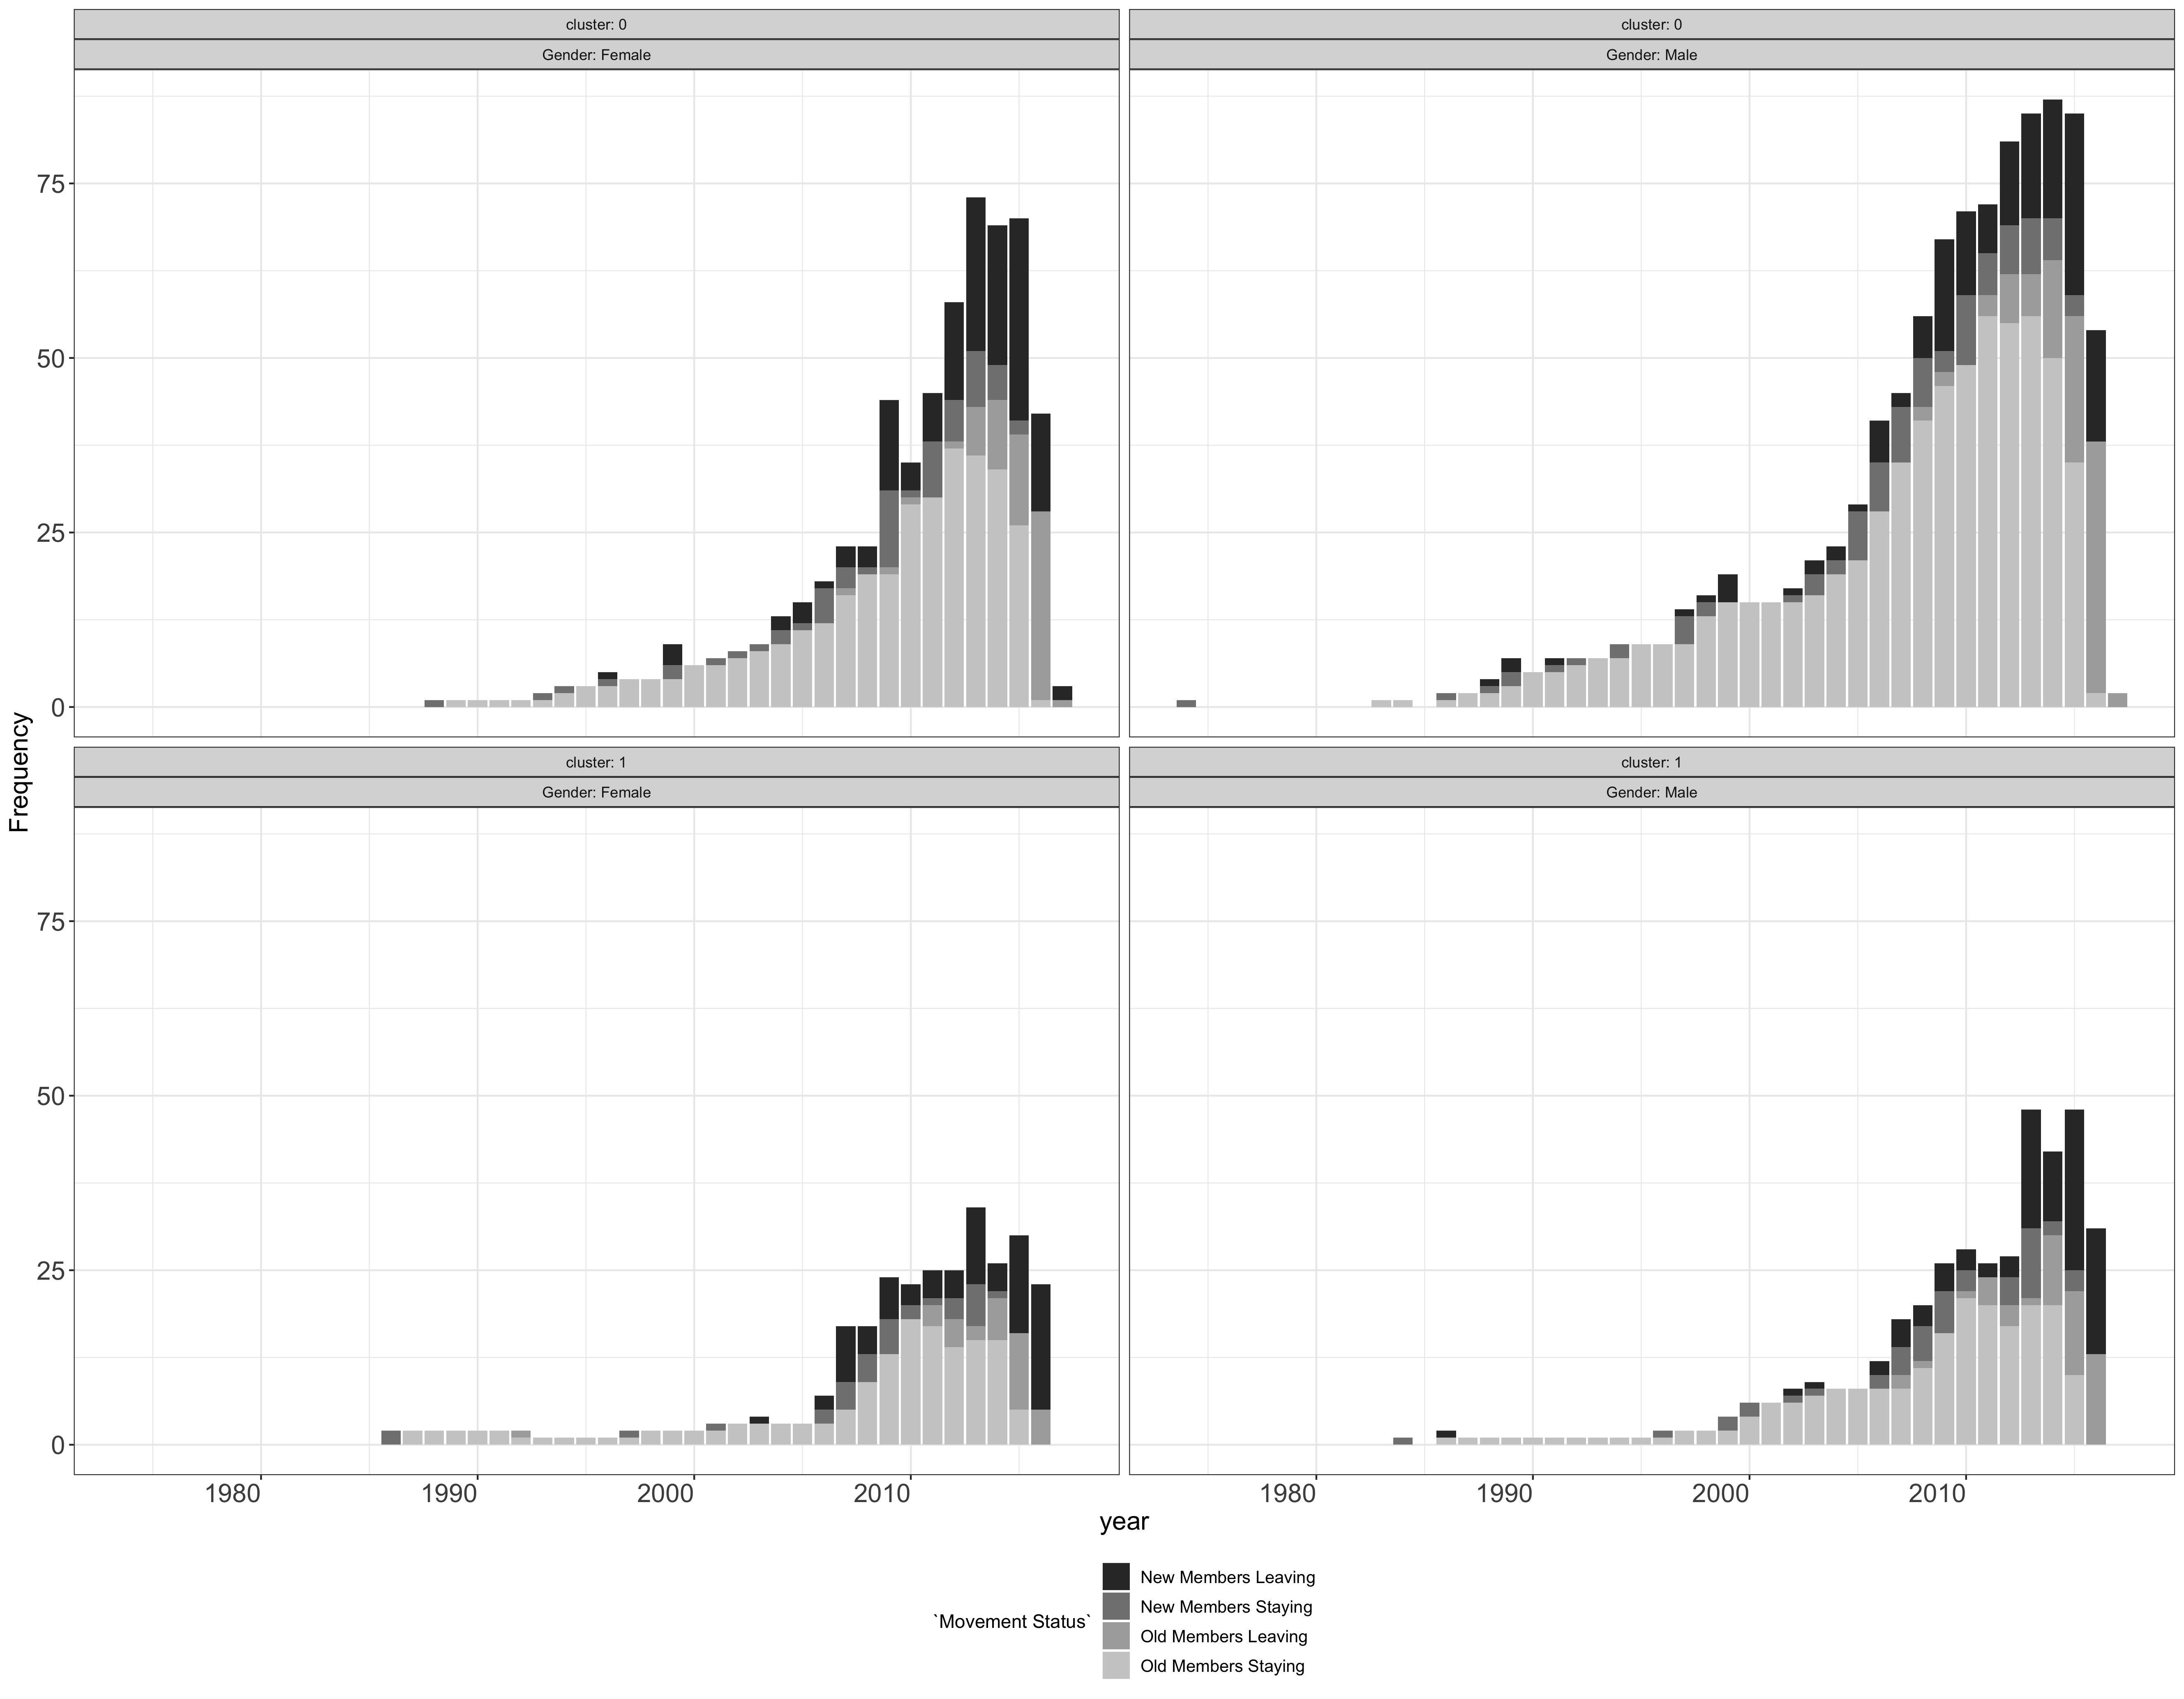
Figure 6.11: Temporal evolution of communities of the giant component, comparison among different gender the x-axis denotes the years, the y-axis denotes the individual authors) (Scopus data)
References
Garvey, WD. 1979. “Communication, the Essence of Science: Facilitating Information Exchange Among Librarians, Scientists, Engineers and Students.”
Zhang, Chenwei, Yi Bu, Ying Ding, and Jian Xu. 2018. “Understanding Scientific Collaboration: Homophily, Transitivity, and Preferential Attachment.” Journal of the Association for Information Science and Technology 69 (1): 72–86.
Wuchty, Stefan, Benjamin F Jones, and Brian Uzzi. 2007. “The Increasing Dominance of Teams in Production of Knowledge.” Science 316 (5827): 1036–9.
Leahey, Erin, Bruce Keith, and Jason Crockett. 2010. “Specialization and Promotion in an Academic Discipline.” Research in Social Stratification and Mobility 28 (2): 135–55.
Long, J Scott. 1992. “Measures of Sex Differences in Scientific Productivity.” Social Forces 71 (1): 159–78.
Grant, Linda, and Kathryn B Ward. 1991. “Gender and Publishing in Sociology.” Gender & Society 5 (2): 207–23.
Edwards, Marc A, and Siddhartha Roy. 2017. “Academic Research in the 21st Century: Maintaining Scientific Integrity in a Climate of Perverse Incentives and Hypercompetition.” Environmental Engineering Science 34 (1): 51–61.
Nederhof, Anton J. 2006. “Bibliometric Monitoring of Research Performance in the Social Sciences and the Humanities: A Review.” Scientometrics 66 (1): 81–100.
Merton, Robert K. 1968. “The Matthew Effect in Science: The Reward and Communication Systems of Science Are Considered.” Science 159 (3810): 56–63.
Katz, J. S., and B. R. Martin. 1997. “What Is Research Collaboration?” Research Policy 26 (1): 1–18.
Batagelj, Vladimir, Anuška Ferligoj, and Flaminio Squazzoni. 2017. “The Emergence of a Field: A Network Analysis of Research on Peer Review.” Scientometrics 113 (1): 503–32.
Sciabolazza, Valerio Leone, Raffaele Vacca, Therese Kennelly Okraku, and Christopher McCarty. 2017. “Detecting and Analyzing Research Communities in Longitudinal Scientific Networks.” PloS One 12 (8): e0182516.
Bellotti, Elisa, Luka Kronegger, and Luigi Guadalupi. 2016. “The Evolution of Research Collaboration Within and Across Disciplines in Italian Academia.” Scientometrics 109 (2): 783–811. https://doi.org/10.1007/s11192-016-2068-1.
Moody, James. 2004. “The Structure of a Social Science Collaboration Network: Disciplinary Cohesion from 1963 to 1999.” American Sociological Review 69 (2): 213–38.
Abbott, Andrew. 2001. Chaos of Disciplines. University of Chicago Press.
Newman, Mark EJ, and Michelle Girvan. 2004. “Finding and Evaluating Community Structure in Networks.” Physical Review E 69 (2): 026113.
Babchuk, Nicholas, Bruce Keith, and George Peters. 1999. “Collaboration in Sociology and Other Scientific Disciplines: A Comparative Trend Analysis of Scholarship in the Social, Physical, and Mathematical Sciences.” The American Sociologist 30 (3): 5–21.
Abbott, Andrew. 2000. “Reflections on the Future of Sociology.” Contemporary Sociology 29 (2): 296–300.
Turner, Jonathan H. 2006. “American Sociology in Chaos: Differentiation Without Integration.” The American Sociologist 37 (2): 15–29.
Wallerstein, Immanuel. 2000. “Where Should Sociologists Be Heading?” Contemporary Sociology 29 (2): 306–8.
Hargens, Lowell L. 2004. “What Is Mertonian Sociology of Science?” Scientometrics 60 (1): 63–70.
Akbaritabar, Aliakbar, Niccolò Casnici, and Flaminio Squazzoni. 2018. “The Conundrum of Research Productivity: A Study on Sociologists in Italy.” Scientometrics 114 (3): 859–82.
Marsden, Peter V. 2002. “Egocentric and Sociocentric Measures of Network Centrality.” Social Networks 24 (4): 407–22.
Lusher, Dean, Johan Koskinen, and Garry Robins. 2013. Exponential Random Graph Models for Social Networks: Theory, Methods, and Applications. Cambridge University Press.
Lazega, Emmanuel, Marie-Thérèse Jourda, Lise Mounier, and Rafaël Stofer. 2008. “Catching up with Big Fish in the Big Pond? Multi-Level Network Analysis Through Linked Design.” Social Networks 30 (2): 159–76.
Newman, Mark EJ. 2001a. “Scientific Collaboration Networks. I. Network Construction and Fundamental Results.” Physical Review E 64 (1): 016131.
Newman, Mark EJ. 2001b. “The Structure of Scientific Collaboration Networks.” Proceedings of the National Academy of Sciences 98 (2): 404–9.
De Stefano, Domenico, Vittorio Fuccella, Maria Prosperina Vitale, and Susanna Zaccarin. 2013. “The Use of Different Data Sources in the Analysis of Co-Authorship Networks and Scientific Performance.” Social Networks 35 (3): 370–81.
Mucha, Peter J, Thomas Richardson, Kevin Macon, Mason A Porter, and Jukka-Pekka Onnela. 2010. “Community Structure in Time-Dependent, Multiscale, and Multiplex Networks.” Science 328 (5980): 876–78.
Traag, Vincent. 2015. “Louvain-Igraph.” http://louvain-igraph.readthedocs.io/en/latest/.
Traag, Vincent. 2014. Algorithms and Dynamical Models for Communities and Reputation in Social Networks. Springer.
Traag, Vincent A, Paul Van Dooren, and Yurii Nesterov. 2011. “Narrow Scope for Resolution-Limit-Free Community Detection.” Physical Review E 84 (1): 016114.
Reichardt, Jörg, and Stefan Bornholdt. 2004. “Detecting Fuzzy Community Structures in Complex Networks with a Potts Model.” Physical Review Letters 93 (21): 218701.
Rosvall, Martin, and Carl T. Bergstrom. 2010. “Mapping change in large networks.” PLoS ONE 5 (1). https://doi.org/10.1371/journal.pone.0008694.
Van Eck, Nees Jan, and Ludo Waltman. 2010. “Software Survey: VOSviewer, a Computer Program for Bibliometric Mapping.” Scientometrics 84 (2): 523–38.
Eck, Nees Jan van, Ludo Waltman, Rommert Dekker, and Jan van den Berg. 2010. “A Comparison of Two Techniques for Bibliometric Mapping: Multidimensional Scaling and Vos.” Journal of the Association for Information Science and Technology 61 (12): 2405–16.
Bianchi, Federico, Niccolò Casnici, and Flaminio Squazzoni. 2018. “Solidarity as a Byproduct of Professional Collaboration: Social Support and Trust in a Coworking Space.” Social Networks 54: 61–72.
Palla, Gergely, Albert-László Barabási, and Tamás Vicsek. 2007. “Quantifying Social Group Evolution.” Nature 446 (7136): 664.
Teele, Dawn Langan, and Kathleen Thelen. 2017. “Gender in the Journals: Publication Patterns in Political Science.” PS: Political Science & Politics 50 (2): 433–47.
Abramo, Giovanni, Ciriaco Andrea D’Angelo, and Alessandro Caprasecca. 2009b. “Gender Differences in Research Productivity: A Bibliometric Analysis of the Italian Academic System.” Scientometrics 79 (3): 517–39.
Cole, Jonathan R, and Harriet Zuckerman. 1984. “The Productivity Puzzle.” Advances in Motivation and Achievement. Women in Science. JAI Press, Greenwich, CT.
Leahey, Erin. 2006. “Gender Differences in Productivity: Research Specialization as a Missing Link.” Gender & Society 20 (6): 754–80.
Mongeon, Philippe, and Adèle Paul-Hus. 2016. “The Journal Coverage of Web of Science and Scopus: A Comparative Analysis.” Scientometrics 106 (1): 213–28.
Leydesdorff, L., H. W. Park, and C. Wagner. 2014. “International Coauthorship Relations in the Social Sciences Citation Index: Is Internationalization Leading the Network?” Journal of the Association for Information Science and Technology 65 (10): 2111–26.
A slightly different version of this chapter with the same title coauthored with Vincent Traag, Alberto Caimo and Flaminio Squazzoni has been published in (Akbaritabar, A., Traag, V. A., Caimo, A., & Squazzoni, F. (2020). Italian Sociologists: A Community of Disconnected Groups. Scientometrics. https://doi.org/10.1007/s11192-020-03555-w).↩
Sectors established by MIUR are as follows: General sociology (SPS/07), Sociology of culture and communication (SPS/08), Economic sociology (SPS/09), Environmental sociology (SPS/10), Political sociology (SPS/11) and Sociology of law and social change (SPS/12).↩
We wrote an R (2016) script to interact with Scopus API. It searched each author’s last and first name in Scopus and extracted all publications records. Data gathering started by sending search queries to Scopus API on July 27th 2016, while from September 8th 2016 we gathered Scopus CSV exports of all available information on publications through Scopus web interface to cover shortages with data from API. To work on data, we used base (2016), dplyr (2016), igraph (2006), ERGM (in Statnet) (2008, 2016), stargazer (2015), ggplot2 (2009), tidyverse (2017), jsonlite (2014) and stringdist (2014) packages in R (2016) to write data cleaning and statistical analysis procedures.↩
We controlled for IDs duplication or multiplicity by cross-checking Scopus web interface data with information extracted from API (using the R scripts described before).↩
In ERGM terms, absdiff is used to check for close or far distance between the nodes over a numerical variable. Here we have used this effect for earliest (first) and latest (last) publication dates and total number of publications. A negative result shows higher similarity or less distance in numerical variable (e.g., closer date of earliest or latest publication)↩
This means that highly prolific authors tend to collaborate with low prolific authors who are not necessarily younger because they have significant homophily in earliest and latest date of publications, i.e. academic age and seniority. This can be due to the fact that although the number of publications was increasing over time (see Figure 6.1), the total number of publications for each author in the sample was highly skewed (Skewness = 5.93 which is in line with previous research Akbaritabar, Casnici, and Squazzoni (2018)) and the pool of potential collaborators for each author potentially included highly prolific and low prolific authors. Moreover, this can be the effect of the data gathering process. While we have looked at all articles throughout the scientific career of Italian sociologists and their collaborators, we could not include all articles of these collaborators in a one by one basis. This means that a person, either senior or junior, could appear in the sample only when s/he collaborated with an Italian sociologist in a Scopus tracked publication, so having a lower number of publications.↩
In order to compare different parameters’ effect in ERGM results, it is essential to calculate and compare the odds ratio. However, it is possible to compare the change in the coefficient of the same parameter over different models to judge the change in the importance of the parameter among different models↩